//+------------------------------------------------------------------+
//|                                              Avg Daily Range.mq4 |
//|                 Copyright © 2005, tageiger aka fxid10t@yahoo.com |
//|                                        http://www.metatrader.org |
//+------------------------------------------------------------------+
#property copyright "Copyright © 2005, tageiger aka fxid10t@yahoo.com"
#property link      "http://www.metatrader.org"

#property indicator_chart_window
#property indicator_buffers 3
#property indicator_color1 Yellow
#property indicator_color2 SpringGreen
#property indicator_color3 Tomato
//---- buffers
double ExtMapBuffer1[];
double ExtMapBuffer2[];
double ExtMapBuffer3[];

double rng,sum.rng,avg.rng;

int init()  {
//---- indicators
   SetIndexStyle(0,DRAW_LINE);
   SetIndexBuffer(0,ExtMapBuffer1);
   SetIndexStyle(1,DRAW_LINE);
   SetIndexBuffer(1,ExtMapBuffer2);
   SetIndexStyle(2,DRAW_LINE);
   SetIndexBuffer(2,ExtMapBuffer3);
//----
return(0);}

int deinit()   {return(0);}

int start() {
   int    counted_bars=IndicatorCounted();
   rng=0;sum.rng=0;avg.rng=0;

   for(int i=0;i<Bars;i++) {
      rng=(iHigh(Symbol(),PERIOD_D1,i)-iLow(Symbol(),PERIOD_D1,i));
      sum.rng+=rng;
   }

   int db=iBars(Symbol(),1440);
   avg.rng=sum.rng/db;

//   for(int t=0;t<db;t++)   {
      for(int s=0;s<Bars;s++) {

      ExtMapBuffer2[s]=(iOpen(Symbol(),PERIOD_D1,s)+(avg.rng/2));
      ExtMapBuffer3[s]=(iOpen(Symbol(),PERIOD_D1,s)-(avg.rng/2));
   }//  }
   Comment("Last Tick: ",TimeToStr(CurTime(),TIME_DATE|TIME_SECONDS),"\n",
           "Sum of Daily Ranges:",sum.rng,"\n",
           "Average Range:",avg.rng,"\n",
           "i:",i+1);


return(0);}
//+------------------------------------------------------------------+
Sample
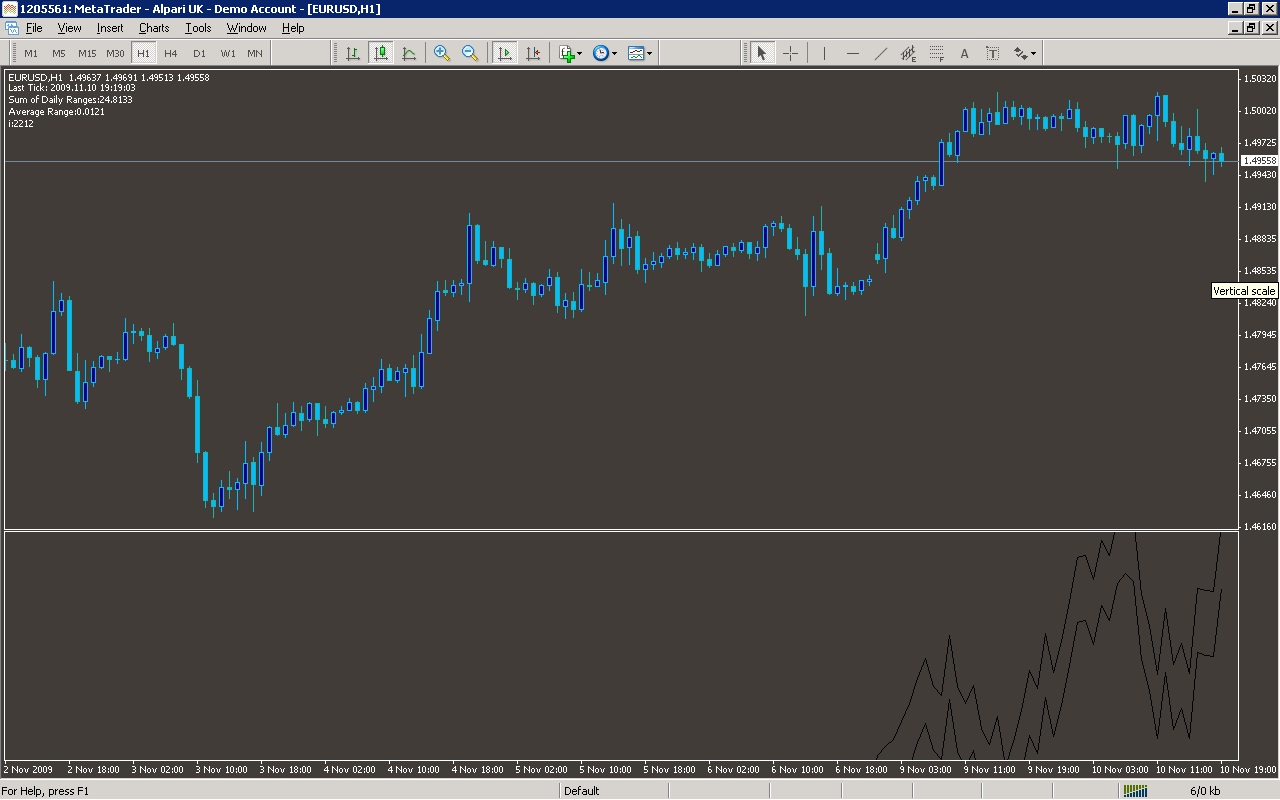
Analysis
Market Information Used:
Series array that contains the highest prices of each bar
Series array that contains the lowest prices of each bar
Series array that contains open prices of each bar
Indicator Curves created:
Implements a curve of type DRAW_LINE
Indicators Used:
Custom Indicators Used:
Order Management characteristics:
Other Features: