//+------------------------------------------------------------------+
//|                               BatFink Trend Change Indicator.mq4 |
//|                                                       Mark Jupp. |
//|                                        http://www.metaquotes.net |
//+------------------------------------------------------------------+

#property copyright "Mark Jupp."
#property link      "http://www.metaquotes.net"

#property indicator_separate_window
#property indicator_buffers 2
#property  indicator_color1 Blue
#property indicator_color2 OrangeRed

extern int period=100;
extern bool YesClose=true;

int candle;

//---- buffers

double ExtMapBuffer1[];
double ExtMapBuffer2[];
double ExtMapBuffer3[];

//+------------------------------------------------------------------+
//| Custom indicator initialization function                         |
//+------------------------------------------------------------------+

int upOn=0;

int init()
  {
//---- indicators

   SetIndexStyle(0,DRAW_HISTOGRAM);
   SetIndexBuffer(0,ExtMapBuffer1);
   SetIndexStyle(1,DRAW_HISTOGRAM);
   SetIndexBuffer(1,ExtMapBuffer2);
   SetIndexStyle(2,DRAW_HISTOGRAM);
   SetIndexBuffer(2,ExtMapBuffer3);
   IndicatorDigits(Digits+1);

//+------------------------------------------------------------------+
//| Indicator Description - 100 period trend change                  |
//+------------------------------------------------------------------+

   IndicatorShortName("BatFink Trend Change Indicator");
   SetIndexLabel(1,NULL);
   SetIndexLabel(2,NULL);
   return(0);
  }

//+------------------------------------------------------------------+
//| Custom indicator iteration function                              |
//+------------------------------------------------------------------+

   int start()
  {

   int    limit;
   int    counted_bars=IndicatorCounted();
   double prev,current,old;
   double Value=0,Value1=0,Value2=0,BatFink=0,BatFink1=0,BatFink2=0;
   double price;
   double MinL=0;
   double MaxH=0;
   if (YesClose==true){candle=1;}else{candle=0;}

   if(counted_bars>0) counted_bars--;
   limit=Bars-counted_bars;

   for(int i=0; i<limit; i++)
    {  MaxH = High[Highest(NULL,0,MODE_HIGH,period,i)];
       MinL = Low[Lowest(NULL,0,MODE_LOW,period,i)];
         price = (High[i]+Low[i])/2;
            Value = 0.33*2*((price-MinL)/(MaxH-MinL)-0.5) + 0.67*Value1;
            Value=MathMin(MathMax(Value,-0.999),0.999);
      ExtMapBuffer1[i]=0.5*MathLog((1+Value)/(1-Value))+0.5*BatFink1;
      Value1=Value;
      BatFink1=ExtMapBuffer1[i];
    }

   bool up=true;
   //bool upOn;
   for(i=limit-2; i>=0; i--)
     {
      current=ExtMapBuffer1[i];
      prev=ExtMapBuffer1[i+1];

      if (((current<0)&&(prev>0))||(current<0))   up= false;
      if (((current>0)&&(prev<0))||(current>0))   up= true;

      if(!up)
        {
         ExtMapBuffer1[i]=current;
        if ((upOn!=1)&&(i==1)){SendMail("BatFink Turned Down on " + Symbol(),"");
         Alert("BatFink Turned Down on " + Symbol());
         upOn=1;}

         ExtMapBuffer2[i]=0.0;
        }

       else
         {

          ExtMapBuffer2[i]=current;
          if ((upOn!=2)&&(i==1)){SendMail("BatFink Turned Up on " + Symbol(),"");
          Alert("BatFink Turned Up on " + Symbol());
          upOn=2;}
          ExtMapBuffer3[i]=0.0;
         }
     }

   return(0);
  }

//+------------------------------------------------------------------+
Sample
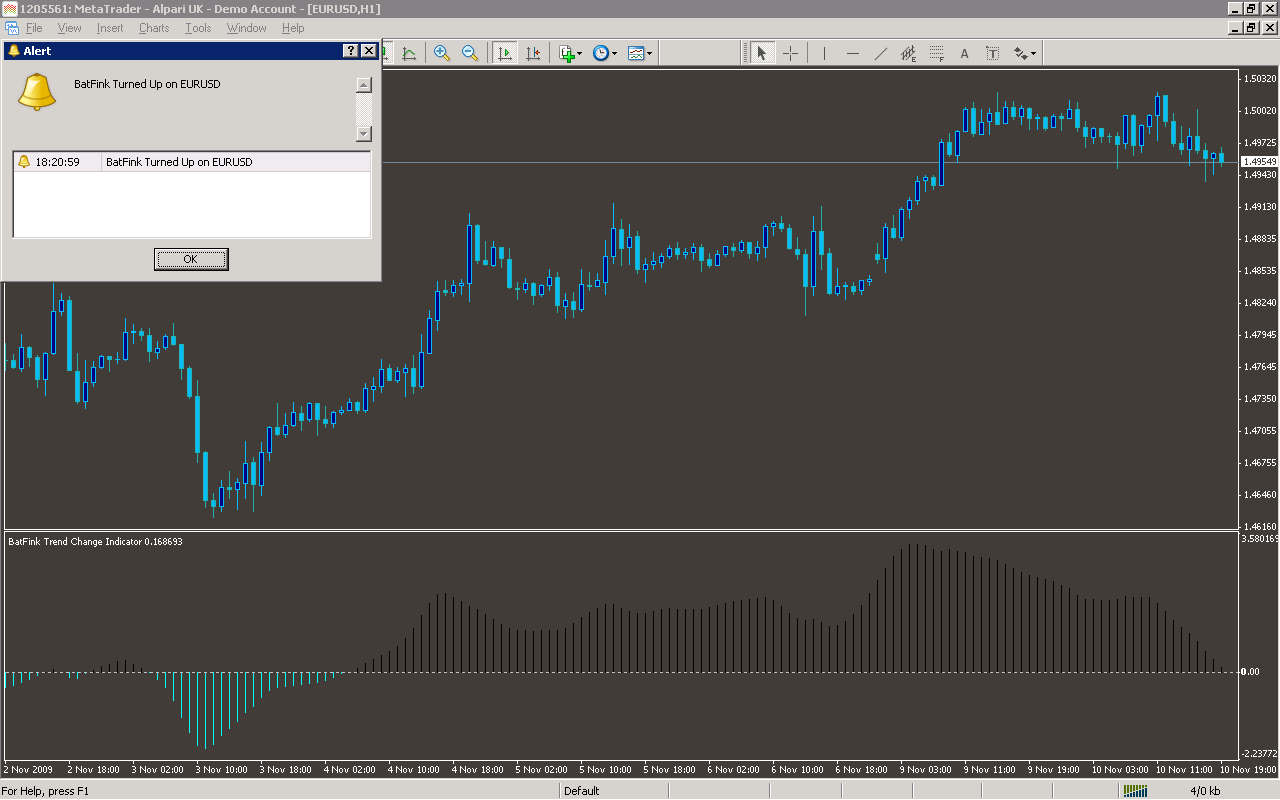
Analysis
Market Information Used:
Series array that contains the highest prices of each bar
Series array that contains the lowest prices of each bar
Indicator Curves created:
Implements a curve of type DRAW_HISTOGRAM
Indicators Used:
Custom Indicators Used:
Order Management characteristics:
Other Features:
It sends emails
It issuies visual alerts to the screen