/*-----------------------------+
|			       |
| Shared by www.Aptrafx.com    |
|			       |
+------------------------------*/

//+------------------------------------------------------------------+
//|                                                  BrainTrend1.mq4 |
//|                                     BrainTrading Inc. System 7.0 |
//|                                     http://www.braintrading.com  |
//+------------------------------------------------------------------+
#property copyright "BrainTrading Inc. System 7.0"
#property link      "http://www.braintrading.com"

#property indicator_chart_window
#property indicator_buffers 2
#property indicator_color1 Red
#property indicator_color2 Blue
//---- input parameters
extern int       NumBars=500;
//---- buffers
double ExtMapBuffer1[];
double ExtMapBuffer2[];
//+------------------------------------------------------------------+
//| Custom indicator initialization function                         |
//+------------------------------------------------------------------+
int init()
  {
//---- indicators
   SetIndexStyle(0,DRAW_HISTOGRAM);
   SetIndexBuffer(0,ExtMapBuffer1);
   SetIndexStyle(1,DRAW_HISTOGRAM);
   SetIndexBuffer(1,ExtMapBuffer2);

//----
   return(0);
  }
//+------------------------------------------------------------------+
//| Custor indicator deinitialization function                       |
//+------------------------------------------------------------------+
int deinit()
  {
//----

//----
   return(0);
  }
//+------------------------------------------------------------------+
//| Custom indicator iteration function                              |
//+------------------------------------------------------------------+
int start()
  {
  Comment("BrainTrading Inc. System 7.0");
   int    counted_bars=IndicatorCounted();

double    value2=0;
double    value11=0;
double    x1=0;
double    x2=0;
double    Range=0;
double    val1=0;
double    val2=0;
int       shift=0;
double    h1=0;
double    h2=0;
double    r1=0;
string    vs=" ";
double    fs=0;
double    st=0;
double    h10=0;
double    abrs=0;
double    d=2.3;
double    f=7;
double    p=0;
double    h11=0;
double    h12=0;
double    h13=0;
double    const=0;
double    orig=0;
double    sxs=0;
double    sms=0;
double    temp=0;
double    h5=0;
double    r1s=0;
double    r2s=0;
double    r3s=0;
double    r4s=0;
double    pt=0;
double    pts=0;
double    r2=0;
double    r3=0;
double    r4=0;
double    tt=0;

st=1;
if (st == 1)
   {
   value11 = 9;
   x1 = 53;
   x2 = 47;
   if (Bars < NumBars) abrs = Bars - 11; else abrs = NumBars - 11;

 shift=abrs;

while(shift>=0)
      {
      Range = iATR(NULL,0,f,shift);
      value2 = iStochastic(NULL,0,value11,value11,1,0,0,0,shift);
      val1 = 0;
      val2 = 0;
      if (value2 < x2 && MathAbs(Close[shift] - Close[shift + 2]) > Range / d ) p = 1;
      if (value2 > x1 && MathAbs(Close[shift] - Close[shift + 2]) > Range / d ) p = 2;
      if ( (value2 < x2 && p == 1) || (value2 < x2 && p == 0)  )
         {
         if ( MathAbs(Close[shift] - Close[shift + 2]) > Range / d )
            {
            val1 = High[shift];
            val2 = Low[shift];
            }
         }
      if ((value2 > x1 && p == 2) || (value2 > x1 && p == 0) )
         {
         val2 = High[shift];
         val1 = Low[shift];
         }
      ExtMapBuffer1[shift]=val1;
      ExtMapBuffer2[shift]=val2;

     shift--;
      }
   }


//----
   return(0);
  }
//+------------------------------------------------------------------+
Sample
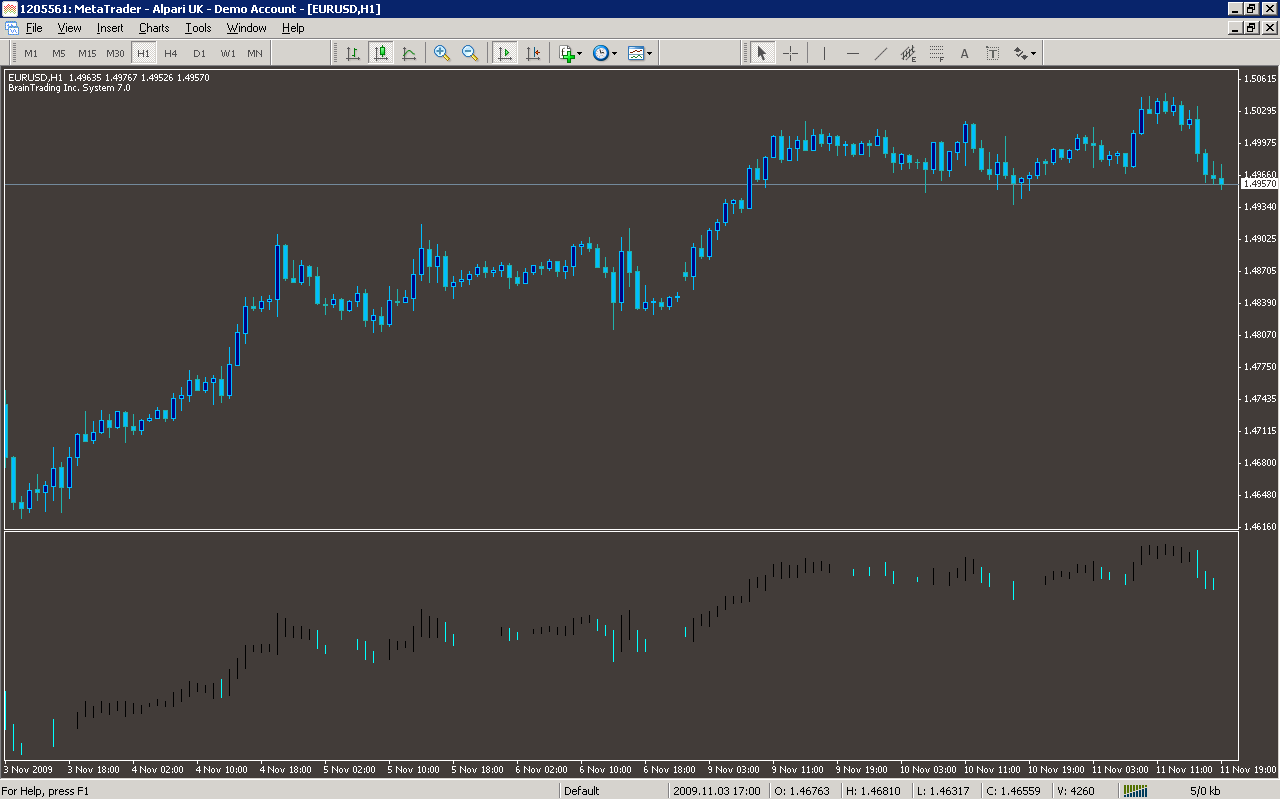
Analysis
Market Information Used:
Series array that contains close prices for each bar
Series array that contains the highest prices of each bar
Series array that contains the lowest prices of each bar
Indicator Curves created:
Implements a curve of type DRAW_HISTOGRAM
Indicators Used:
Indicator of the average true range
Stochastic oscillator
Custom Indicators Used:
Order Management characteristics:
Other Features: