/*-----------------------------+
|			       |
| Shared by www.Aptrafx.com    |
|			       |
+------------------------------*/

#property indicator_separate_window
#property indicator_buffers 2
#property indicator_color1 LightSeaGreen
#property indicator_color2 Red
//---- input parameters
extern int TTFbars=15;
//15=default number of bars for computation
extern int TopLine=50;
extern int BottomLine=-50;
extern int t3_period=5;
extern double b=0.7;
//---- buffers
double MainBuffer[];
double SignalBuffer[];
//----
int draw_begin1=0;
int draw_begin2=0;
double b2=0;
double b3=0;
double c1=0;
double c2=0;
double c3=0;
double c4=0;
double r=0;
double w1=0;
double w2=0;
double e1 = 0;
double e2 = 0;
double e3 = 0;
double e4 = 0;
double e5 = 0;
double e6 = 0;
double  HighestHighRecent=0;
double  HighestHighOlder =0;
double  LowestLowRecent =0;
double  LowestLowOlder =0;
double  BuyPower =0;
double  SellPower=0;
double  TTF=0;

//+------------------------------------------------------------------+
//| Custom indicator initialization function                         |
//+------------------------------------------------------------------+
int init()
  {
   string short_name;
//---- 2 additional buffers are used for counting.
   IndicatorBuffers(2);
//---- indicator lines
   SetIndexStyle(0,DRAW_LINE);
   SetIndexBuffer(0, MainBuffer);
   SetIndexStyle(1,DRAW_LINE);
   SetIndexBuffer(1, SignalBuffer);
//---- name for DataWindow and indicator subwindow label
   short_name="TTF("+TTFbars;
   IndicatorShortName(short_name);
   SetIndexLabel(0,short_name);
   SetIndexLabel(1,"Signal");
//----
   draw_begin1=TTFbars*2+1;
   draw_begin2=draw_begin1;
   SetIndexDrawBegin(0,draw_begin1);
   SetIndexDrawBegin(1,draw_begin2);

   b2=b*b;
   b3=b2*b;
   c1=-b3;
   c2=(3*(b2+b3));
   c3=-3*(2*b2+b+b3);
   c4=(1+3*b+b3+3*b2);

   r=t3_period;

   if (r<1) r=1;
   r = 1 + 0.5*(r-1);
   w1 = 2 / (r + 1);
   w2 = 1 - w1;

//----
   return(0);
  }
//+------------------------------------------------------------------+
//| ttf                                            |
//+------------------------------------------------------------------+
int start()
  {
   int    i,k;
   int    counted_bars=IndicatorCounted();
   double price;
//----
   if(Bars<=draw_begin2) return(0);
//---- initial zero
   if(counted_bars<1)
     {
      for(i=1;i<=draw_begin1;i++) MainBuffer[Bars-i]=0;
      for(i=1;i<=draw_begin2;i++) SignalBuffer[Bars-i]=0;
     }
//---- %K line
   i=Bars-draw_begin1;
   if(counted_bars>draw_begin1) i=Bars-counted_bars-1;
   while(i>=0)
     {
  HighestHighRecent=High[Highest(NULL,0,MODE_HIGH,TTFbars,i)];//High[Highest(MODE_HIGH,shift+TTFbars-1,TTFbars)];
  HighestHighOlder =High[Highest(NULL,0,MODE_HIGH,TTFbars,i+TTFbars)];//High[Highest(MODE_HIGH,shift+TTFbars*2-1,TTFbars)];
  LowestLowRecent =Low[Lowest(NULL,0,MODE_LOW,TTFbars,i)];//Low [Lowest (MODE_LOW ,shift+TTFbars-1,TTFbars)];
  LowestLowOlder =Low[Lowest(NULL,0,MODE_LOW,TTFbars,i+TTFbars)];//Low [Lowest (MODE_LOW ,shift+TTFbars*2-1,TTFbars)];
  BuyPower =HighestHighRecent-LowestLowOlder;
  SellPower=HighestHighOlder -LowestLowRecent;
  TTF=(BuyPower-SellPower)/(0.5*(BuyPower+SellPower))*100;

  e1 = w1*TTF + w2*e1;
  e2 = w1*e1 + w2*e2;
  e3 = w1*e2 + w2*e3;
  e4 = w1*e3 + w2*e4;
  e5 = w1*e4 + w2*e5;
  e6 = w1*e5 + w2*e6;

  TTF = c1*e6 + c2*e5 + c3*e4 + c4*e3;

  MainBuffer[i]=TTF;
  i--;
 }
//---- last counted bar will be recounted
   if(counted_bars>0) counted_bars--;
   int limit=Bars-counted_bars;
//---- signal line is simple movimg average
   for(i=0; i<limit; i++) {
      if (MainBuffer[i]>=0)
         SignalBuffer[i]=TopLine;
      else
         SignalBuffer[i]=BottomLine;
   }
//----
   return(0);
  }
//+------------------------------------------------------------------+
Sample
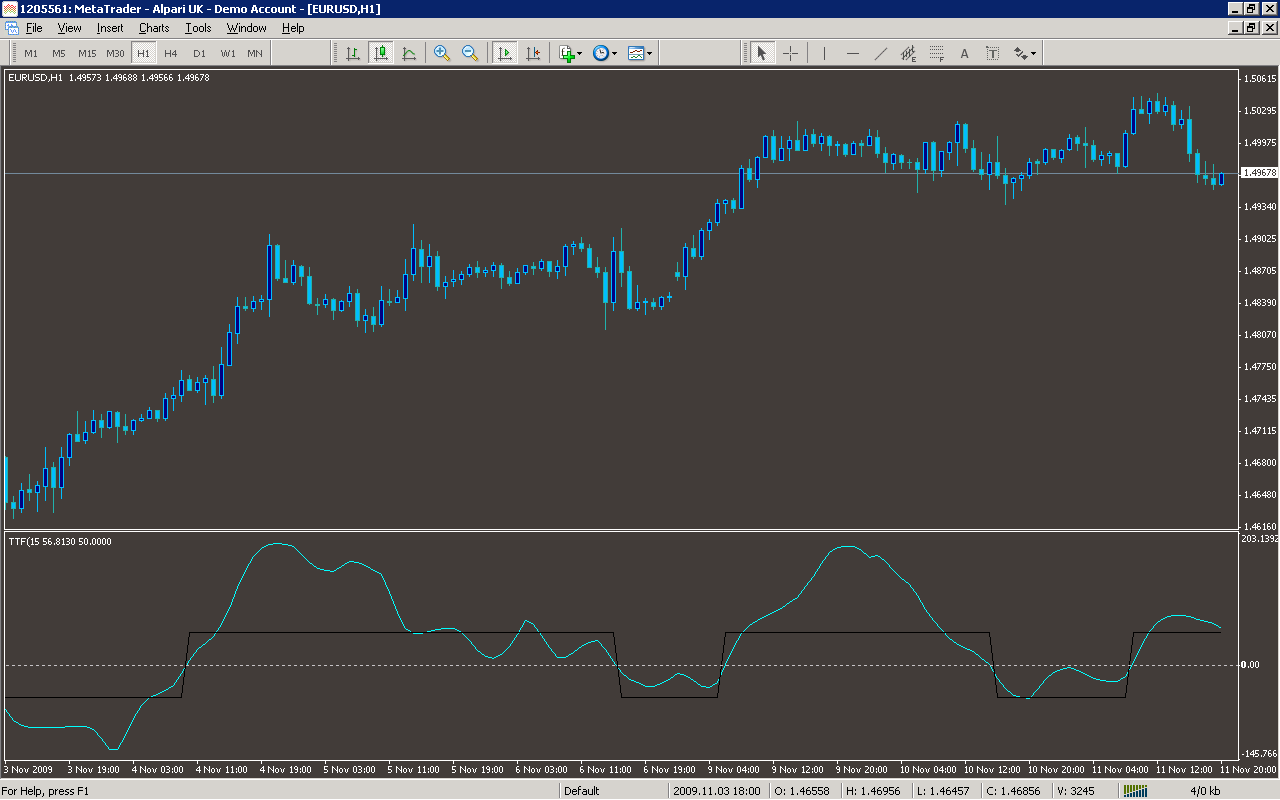
Analysis
Market Information Used:
Series array that contains the highest prices of each bar
Series array that contains the lowest prices of each bar
Indicator Curves created:
Implements a curve of type DRAW_LINE
Indicators Used:
Custom Indicators Used:
Order Management characteristics:
Other Features: