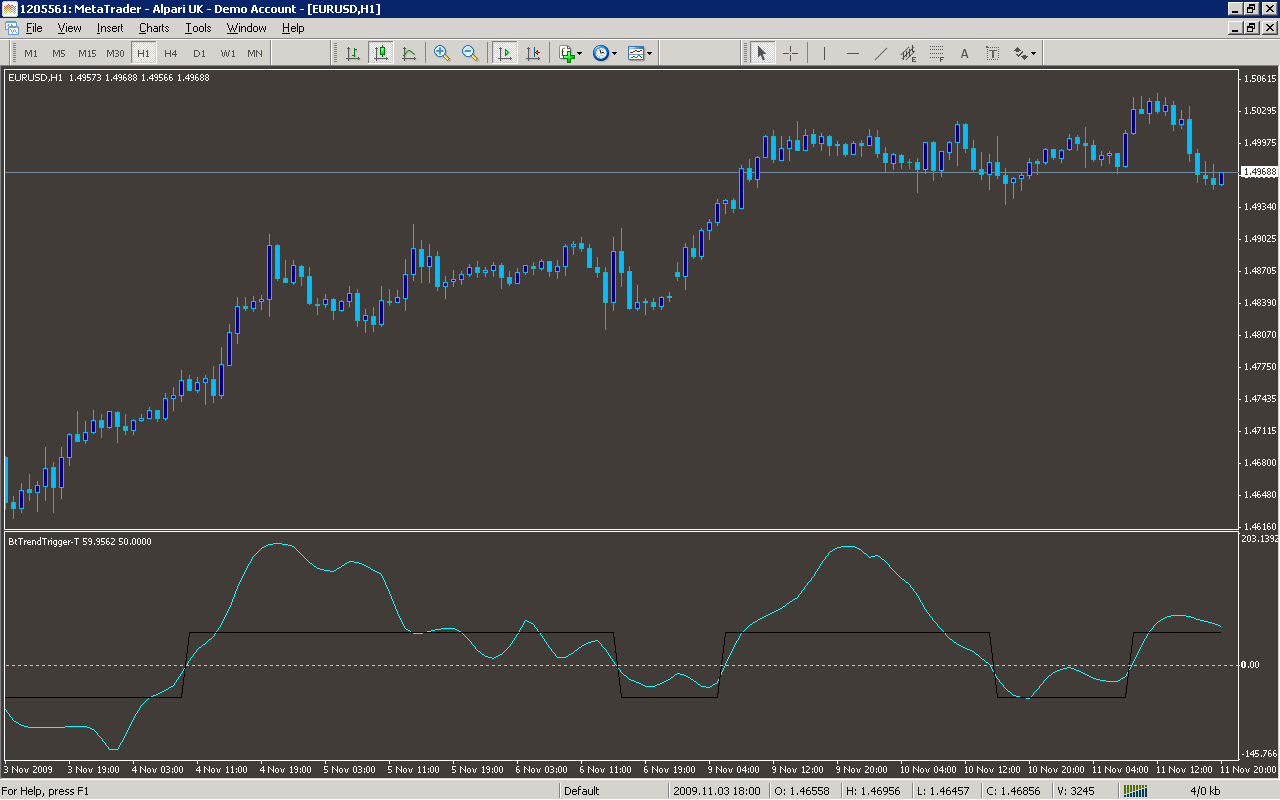
//+------------------------------------------------------------------+
//|                                             BtTrendTrigger-T.mq4 |
//|                                                                  |
//|                                                                  |
//+------------------------------------------------------------------+
#property copyright ""
#property link      ""

#property indicator_separate_window
#property indicator_buffers 2
#property indicator_color1 Gold
#property indicator_color2 Red
//---- input parameters
extern int TTFbars=15; //15=default number of bars for computation.
extern int t3_period=5;
extern double b=0.7;
extern int ppor=50,mpor=-50;
extern int barBegin=1000; //<1000 recommended for faster speed, 0=All bars computed & plotted.

// Variable Specific:
string IndicatorName="py.TTF";
string Version="S01";
double HighestHighRecent;
double HighestHighOlder;
double LowestLowRecent;
double LowestLowOlder;
double BuyPower;
double SellPower;
double TTF;
double t3;
double e1;
double e2;
double e3;
double e4;
double e5;
double e6;
double c1;
double c2;
double c3;
double c4;
double r;
double w1;
double w2;
double b2;
double b3;

// Variable Generic, mostly for module flow control:
int shift;
int count;
bool is_First=True;
int loopBegin;
int prevBars;
int PrevTime;
int tick;
int prevShift=99999;
int badPlotBars; //Discarded first (old) bars with bad computed values
int firstPlotBar;
double CheckSum;
double CheckSumPrev;
string Msg;

//---- buffers
double ExtMapBuffer1[];
double ExtMapBuffer2[];
//+------------------------------------------------------------------+
//| Custom indicator initialization function                         |
//+------------------------------------------------------------------+
int init()
  {
//---- indicators
   SetIndexStyle(0,DRAW_LINE);
   SetIndexBuffer(0,ExtMapBuffer1);
   SetIndexStyle(1,DRAW_LINE);
   SetIndexBuffer(1,ExtMapBuffer2);
//----
   return(0);
  }
//+------------------------------------------------------------------+
//| Custor indicator deinitialization function                       |
//+------------------------------------------------------------------+
int deinit()
  {
//----

//----
   return(0);
  }
//+------------------------------------------------------------------+
//| Custom indicator iteration function                              |
//+------------------------------------------------------------------+
int start(){


   b2 = b * b;
   b3 = b2 * b;
   c1 = (-b3);
   c2 = (3 * (b2 + b3));
   c3 = (-3) * (2 * b2 + b + b3);
   c4 = (1 + 3 * b + b3 + 3 * b2);

   r = t3_period;

   if(r < 1) r = 1;
   r = 1 + 0.5 * (r - 1);
   w1 = 2 / (r + 1);
   w2 = 1 - w1;

   /*======================*/
   /* Begin Pre-Loop Setup */
   /*======================*/
   //Check for additional bars loading or total reloadng.

   if(Bars < prevBars || Bars - prevBars > 1)is_First = True;
   prevBars = Bars;

   //Have any Inputs changed?

   CheckSum = TTF + barBegin;

   if(CheckSum != CheckSumPrev)is_First = True;
   CheckSumPrev = CheckSum;
   //--------------------------------------------------------------------

   if(is_First){
      /*This block executes ONLY First Time for each Attachment-To-Chart. If MT is closed or another Profile is selected,
	   the values & parameters for this module are saved, and when MT or this Profile is restarted, it would not be the First
	   Time Attachment-To-Chart. So this block would not execute unless the value of "Bars" has changed. */

      /*==============*/
      /* Check Inputs */
      /*==============*/

	  if(0 > TTFbars || TTFbars > 299){
		 Msg = IndicatorName + " **Input Error** :" + " TTFbars must be between 0 and 300. Cannot=" + TTFbars;
		 Alert(Msg);
		 return(0);
	  }

	  //BarIndexNumber=shift=Bars-1..0

	  if(barBegin > 0 && barBegin < Bars - 1)loopBegin = barBegin; else loopBegin = Bars - 1;

	  /*===================================*/
	  /* Specific for particular indicator */
	  /*===================================*/

	  loopBegin = loopBegin - TTFbars; //Cannot compute early bars

	  /* end Specific */

	  is_First = False;
   }

   /*======================*/
   /* end Pre-Loop Setup */
   /*======================*/

   loopBegin = loopBegin + 1; //Replot previous bar
   for(shift = loopBegin;shift>=0;shift--){
	  /*=================================*/
	  /* Standard Specific Computations */
	  /*=================================*/
	  HighestHighRecent = High[Highest(NULL,0,MODE_HIGH,TTFbars,shift)];
	  HighestHighOlder = High[Highest(NULL,0,MODE_HIGH,TTFbars,shift + TTFbars)];
	  LowestLowRecent = Low [Lowest(NULL,0,MODE_LOW,TTFbars,shift)];
	  LowestLowOlder = Low [Lowest(NULL,0,MODE_LOW,TTFbars,shift+TTFbars)];
	  BuyPower = HighestHighRecent - LowestLowOlder;
	  SellPower = HighestHighOlder - LowestLowRecent;
	  TTF = (BuyPower - SellPower) / (0.5 * (BuyPower + SellPower)) * 100;

	  e1 = w1 * TTF + w2 * e1;
	  e2 = w1 * e1 + w2 * e2;
	  e3 = w1 * e2 + w2 * e3;
	  e4 = w1 * e3 + w2 * e4;
	  e5 = w1 * e4 + w2 * e5;
	  e6 = w1 * e5 + w2 * e6;

	  TTF = c1 * e6 + c2 * e5 + c3 * e4 + c4 * e3;
	  ExtMapBuffer1[shift]=TTF;

		//Dual value trigger +/-100
		if(TTF >= 0)ExtMapBuffer2[shift]=ppor; else ExtMapBuffer2[shift]=mpor;

		loopBegin = loopBegin - 1;
}

   return(0);
  }
//+------------------------------------------------------------------+
Sample
Analysis
Market Information Used:
Series array that contains the highest prices of each bar
Indicator Curves created:
Implements a curve of type DRAW_LINE
Indicators Used:
Custom Indicators Used:
Order Management characteristics:
Other Features:
It issuies visual alerts to the screen
