/*-----------------------------+
|			       |
| Shared by www.Aptrafx.com    |
|			       |
+------------------------------*/

//+------------------------------------------------------------------+
//| BykovTrend_Sig.mq4
//| Ramdass - Conversion only
//+------------------------------------------------------------------+

#property indicator_chart_window
#property indicator_buffers 2
#property indicator_color1 Magenta
#property indicator_color2 Aqua

//---- input parameters
extern int RISK=3;
extern int SSP=9;
extern int CountBars=500;

//---- buffers
double val1[];
double val2[];

//+------------------------------------------------------------------+
//| Custom indicator initialization function                         |
//+------------------------------------------------------------------+
int init()
  {
   string short_name;
//---- indicator line
   IndicatorBuffers(2);
   SetIndexStyle(0,DRAW_ARROW);
   SetIndexArrow(0,234);
   SetIndexStyle(1,DRAW_ARROW);
   SetIndexArrow(1,233);
   SetIndexBuffer(0,val1);
   SetIndexBuffer(1,val2);

//----
   return(0);
  }
//+------------------------------------------------------------------+
//| BykovTrend_Sig                                                   |
//+------------------------------------------------------------------+
int start()
  {
   SetIndexDrawBegin(0,Bars-CountBars+SSP+1);
   SetIndexDrawBegin(1,Bars-CountBars+SSP+1);
   int i,counted_bars=IndicatorCounted();
   int K;
   bool uptrend,old;
   double wpr;

   K=33-RISK;
//----
   if(Bars<=SSP+1) return(0);
//---- initial zero
   if(counted_bars<SSP+1)
   {
      for(i=1;i<=0;i++) val1[CountBars-i]=0.0;
      for(i=1;i<=0;i++) val2[CountBars-i]=0.0;
   }
//----
   i=CountBars-SSP-1;
   if(counted_bars>=SSP+1) i=CountBars-counted_bars-1;
   while(i>=0)
     {

   wpr=iWPR(NULL,0,SSP,i);
   val1[i]=0.0; val2[i]=0.0;
   if (wpr<-100+K) uptrend=false;
   if (wpr>-K) uptrend=true;
   if ((! uptrend==old) && uptrend==true) {val2[i]=Low[i]-5*Point;}
   if ((! uptrend==old) && uptrend==false) {val1[i]=High[i]+5*Point;}
   old=uptrend;

      i--;
     }
   return(0);
  }
//+------------------------------------------------------------------+
Sample
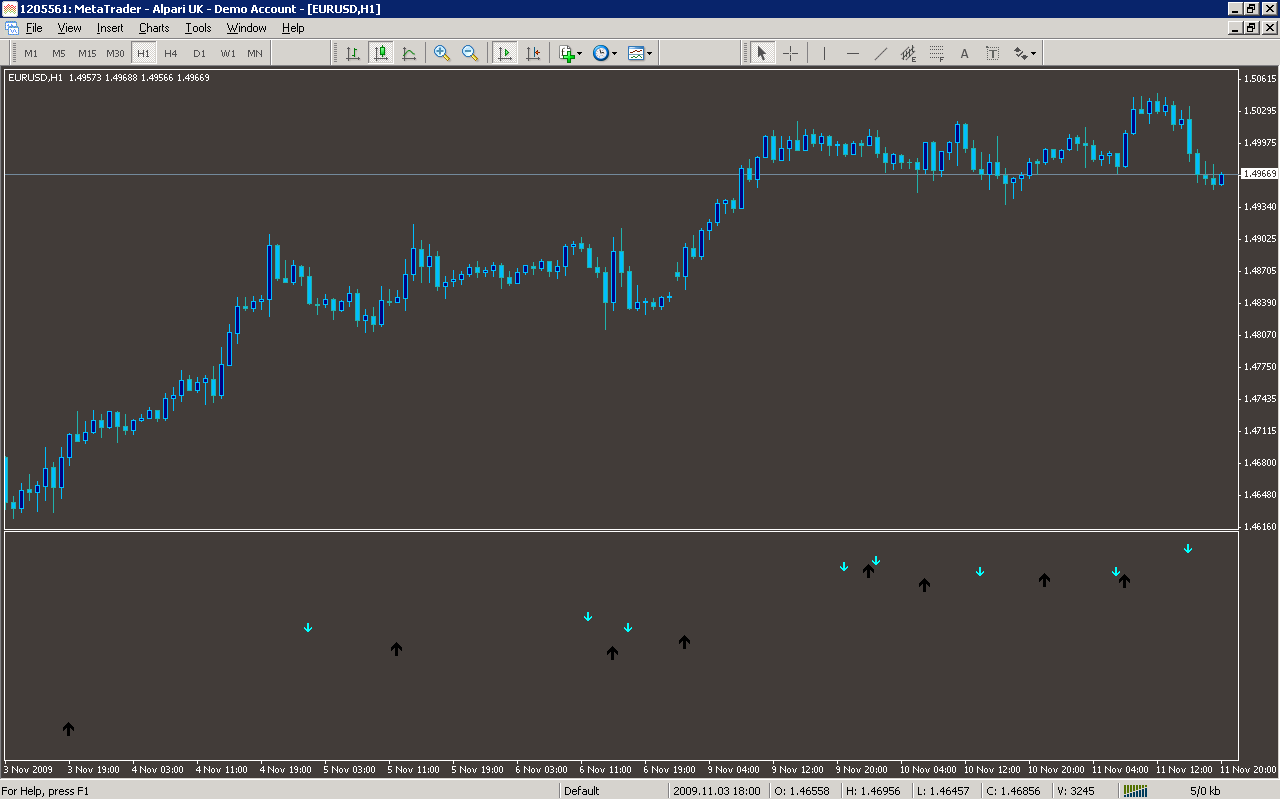
Analysis
Market Information Used:
Series array that contains the lowest prices of each bar
Series array that contains the highest prices of each bar
Indicator Curves created:
Implements a curve of type DRAW_ARROW
Indicators Used:
Larry William percent range indicator
Custom Indicators Used:
Order Management characteristics:
Other Features: