//+------------------------------------------------------------------+
//|BB_Squeeze_4c_JMA                                   bbsqueeze.mq4 |
//|                Copyright © 2005, Nick Bilak, beluck[AT]gmail.com |
//|2007fxtsd  enhanced a little bit by CJ Rivas, carlos[AT]vealo.com |
//+------------------------------------------------------------------+
#property copyright "Copyright © 2005, Nick Bilak"
#property link      "http://metatrader.50webs.com/"

#property indicator_separate_window
#property indicator_buffers 6
#property indicator_color1 C'36,36,255'
#property indicator_color2 Red
#property indicator_color3 C'0,0,191'
#property indicator_color4 Maroon
#property indicator_color5 Orange
#property indicator_color6 SlateBlue

#property  indicator_width1  2
#property  indicator_width2  2
#property  indicator_width3  2
#property  indicator_width4  2


//---- input parameters
extern int       LRegrPeriod = 14;
extern int       JMAPhase  = 0;

extern int       bolPrd=20;
extern double    bolDev=2.0;
extern int       keltPrd=20;
extern double    keltFactor=1.5;
extern int       MaxBarsToCount =900;
extern bool      DataDisplayOff  = true;

//extern int       momPrd=12;
//---- buffers
double upB[];
double upB2[];
double loB[];
double loB2[];
double upK[];
double loK[];

int i,j,slippage=3;
double breakpoint=0.0;
double ema=0.0;
int peakf=0;
int peaks=0;
int valleyf=0;
int valleys=0, limit=0;
double ccis[61],ccif[61];
double delta=0;
double ugol=0;
//+------------------------------------------------------------------+
//| Custom indicator initialization function                         |
//+------------------------------------------------------------------+
int init()
  {
//---- indicators
   SetIndexStyle(0,DRAW_HISTOGRAM,EMPTY);
   SetIndexBuffer(0,upB);
   SetIndexEmptyValue(0,EMPTY_VALUE);

   SetIndexStyle(1,DRAW_HISTOGRAM,EMPTY);
   SetIndexBuffer(1,loB);
   SetIndexEmptyValue(1,EMPTY_VALUE);

   SetIndexStyle(4,DRAW_ARROW,EMPTY);
   SetIndexBuffer(4,upK);
   SetIndexEmptyValue(4,EMPTY_VALUE);
   SetIndexArrow(4,159);
   SetIndexStyle(5,DRAW_ARROW,EMPTY);
   SetIndexBuffer(5,loK);
   SetIndexEmptyValue(5,EMPTY_VALUE);
   SetIndexArrow(5,159);

   SetIndexStyle(2,DRAW_HISTOGRAM,EMPTY);
   SetIndexEmptyValue(2,EMPTY_VALUE);
   SetIndexBuffer(2,upB2);

   SetIndexStyle(3,DRAW_HISTOGRAM,EMPTY);
   SetIndexEmptyValue(3,EMPTY_VALUE);
   SetIndexBuffer(3,loB2);


      SetIndexLabel(0,"upB");
      SetIndexLabel(1,"loB");
      SetIndexLabel(2,"upB2");
      SetIndexLabel(3,"loB2");
      SetIndexLabel(4,"upK");
//    SetIndexLabel(5,"loK");

 if (DataDisplayOff)
  {
   SetIndexLabel(0,"");
   SetIndexLabel(1,"");
   SetIndexLabel(2,"");
   SetIndexLabel(3,"");
   SetIndexLabel(4,"");
   SetIndexLabel(5,"");
  }
   IndicatorShortName("BB_Sqz JMA ("+LRegrPeriod+")");


//----
   return(0);
  }
//+------------------------------------------------------------------+
//| Custor indicator deinitialization function                       |
//+------------------------------------------------------------------+
int deinit()
  {
//----

//----
   return(0);
  }
//+------------------------------------------------------------------+
//| Custom indicator iteration function                              |
//+------------------------------------------------------------------+
int start()
  {
   int   shift, limit=IndicatorCounted();
   double diff,d,dPrev, std,bbs;

   if (limit<0) return(-1);
   if (limit>0) limit--;
      limit=MathMin(Bars-limit,MaxBarsToCount);

   for (shift=limit;shift>=0;shift--)   {
      //d=iMomentum(NULL,0,momPrd,PRICE_CLOSE,shift);
      d=LinearRegressionValue(LRegrPeriod,shift);
      dPrev=LinearRegressionValue(LRegrPeriod,shift+1);
      if(d>0) {
         if ((dPrev>0) && (dPrev > d))
         { upB2[shift]=d; upB[shift] = 0; }
          else { upB[shift]= d; upB2[shift] = 0; }
         //upB[shift]=0;
         loB[shift]=0;
         loB2[shift]=0;
      } else {
         if ((dPrev<0) && (dPrev < d))
         { loB2[shift]=d; loB[shift] = 0; }
          else { loB[shift]= d; loB2[shift] = 0; }
         upB[shift]=0;
         upB2[shift]=0;
         //loB[shift]=d;
      }
		diff = iATR(NULL,0,keltPrd,shift)*keltFactor;
		std = iStdDev(NULL,0,bolPrd,MODE_SMA,0,PRICE_CLOSE,shift);
		bbs = bolDev * std / diff;
      if(bbs<1) {
         upK[shift]=0;
         loK[shift]=EMPTY_VALUE;
      } else {
         loK[shift]=0;
         upK[shift]=EMPTY_VALUE;
      }
   }
   return(0);
  }
//+------------------------------------------------------------------+


double LinearRegressionValue(int Len,int shift) {
   double SumBars = 0;
   double SumSqrBars = 0;
   double SumY = 0;
   double Sum1 = 0;
   double Sum2 = 0;
   double Slope = 0;

   SumBars = Len * (Len-1) * 0.5;
   SumSqrBars = (Len - 1) * Len * (2 * Len - 1)/6;

  for (int x=0; x<=Len-1;x++) {
   double HH = Low[x+shift];
   double LL = High[x+shift];
   for (int y=x; y<=(x+Len)-1; y++) {
     HH = MathMax(HH, High[y+shift]);
     LL = MathMin(LL, Low[y+shift]);
   }
    Sum1 += x* (Close[x+shift]-((HH+LL)/2 + iCustom(NULL,0,"JMA",Len,JMAPhase,0,x+shift))/2);
    SumY +=    (Close[x+shift]-((HH+LL)/2 + iCustom(NULL,0,"JMA",Len,JMAPhase,0,x+shift))/2);
  }
  Sum2 = SumBars * SumY;
  double Num1 = Len * Sum1 - Sum2;
  double Num2 = SumBars * SumBars-Len * SumSqrBars;

  if (Num2 != 0.0)  {
    Slope = Num1/Num2;
  } else {
    Slope = 0;
  }

  double Intercept = (SumY - Slope*SumBars) /Len;
  double LinearRegValue = Intercept+Slope * (Len - 1);

  return (LinearRegValue);

}
Sample
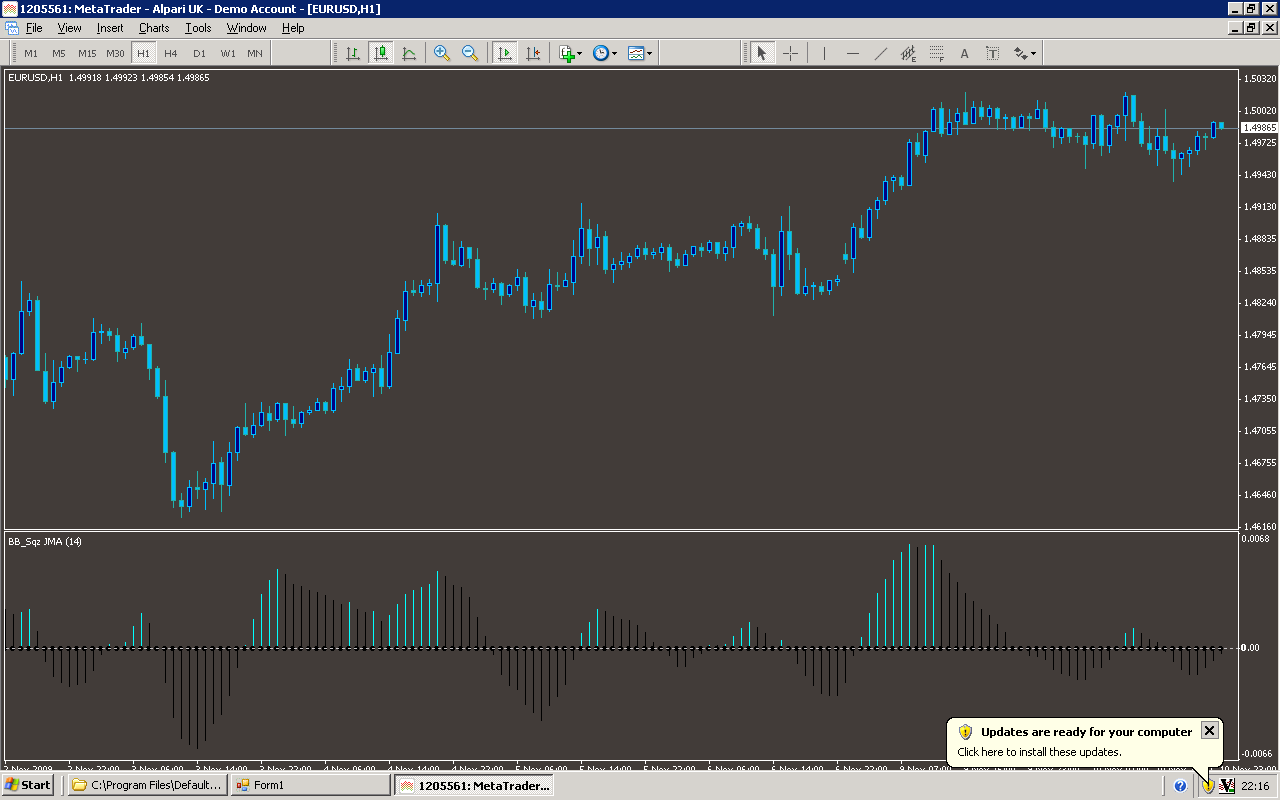
Analysis
Market Information Used:
Series array that contains the lowest prices of each bar
Series array that contains the highest prices of each bar
Series array that contains close prices for each bar
Indicator Curves created:
Implements a curve of type DRAW_HISTOGRAM
Implements a curve of type DRAW_ARROW
Indicators Used:
Indicator of the average true range
Standard Deviation indicator
Custom Indicators Used:
JMA
Order Management characteristics:
Other Features: