//+------------------------------------------------------------------+
//|                                                  camarilladt.mq4 |
//|                      Copyright © 2005, MetaQuotes Software Corp. |
//|                                        http://www.metaquotes.net |
//+------------------------------------------------------------------+
#property copyright "Copyright © 2005, MetaQuotes Software Corp."
#property link      "http://www.metaquotes.net"

#property indicator_chart_window
//---- input parameters
extern bool Alerts = true;
extern int  GMTshift=0;
extern bool Pivot = true;
extern color PivotColor = Yellow;
extern color PivotFontColor = White;
extern int PivotFontSize = 8;
extern int PivotWidth = 1;
extern int PipDistance = 20;
extern color CamFontColor = White;
extern int CamFontSize = 10;
extern bool Fibs = false;
extern color FibColor = Sienna;
extern color FibFontColor = White;
extern int FibFontSize = 8;

double P, H3, H4, H5;
double L3, L4, L5;
double LastHigh,LastLow,x;
bool firstL3=true;
bool firstH3=true;

double D1=0.091667;
double D2=0.183333;
double D3=0.2750;
double D4=0.55;


// Fib variables

double yesterday_high=0;
double yesterday_low=0;
double yesterday_close=0;
double r3=0;
double r2=0;
double r1=0;
double p=0;
double s1=0;
double s2=0;
double s3=0;
double R;

//+------------------------------------------------------------------+
//| Custom indicator initialization function                         |
//+------------------------------------------------------------------+
int init()
  {
//---- indicators
//----
   return(0);
  }
//+------------------------------------------------------------------+
//| Custor indicator deinitialization function                       |
//+------------------------------------------------------------------+
int deinit()
  {
//---- TODO: add your code here
if (Fibs)
{ObjectDelete("R1 Label");
ObjectDelete("R1 Line");
ObjectDelete("R2 Label");
ObjectDelete("R2 Line");
ObjectDelete("R3 Label");
ObjectDelete("R3 Line");
ObjectDelete("S1 Label");
ObjectDelete("S1 Line");
ObjectDelete("S2 Label");
ObjectDelete("S2 Line");
ObjectDelete("S3 Label");
ObjectDelete("S3 Line");
}
if (Pivot)
{
ObjectDelete("P Label");
ObjectDelete("P Line");
}
ObjectDelete("H5 Label");
ObjectDelete("H5 Line");
ObjectDelete("H4 Label");
ObjectDelete("H4 Line");
ObjectDelete("H3 Label");
ObjectDelete("H3 Line");
ObjectDelete("L3 Label");
ObjectDelete("L3 Line");
ObjectDelete("L4 Label");
ObjectDelete("L4 Line");
ObjectDelete("L5 Label");
ObjectDelete("L5 Line");
//----
   return(0);
  }

int DoAlerts()
{
   double DifAboveL3,PipsLimit;
   double DifBelowH3;

   DifBelowH3 = H3 - Close[0];
   DifAboveL3 = Close[0] - L3;
   PipsLimit = PipDistance*Point;

   if (DifBelowH3 > PipsLimit) firstH3 = true;
   if (DifBelowH3 <= PipsLimit && DifBelowH3 > 0)
   {
    if (firstH3)
    {
      Alert("Below Cam H3 Line by ",DifBelowH3, " for ", Symbol(),"-",Period());
      PlaySound("timeout.wav");
      firstH3=false;
    }
   }

   if (DifAboveL3 > PipsLimit) firstL3 = true;
   if (DifAboveL3 <= PipsLimit && DifAboveL3 > 0)
   {
    if (firstL3)
    {
      Alert("Above Cam L3 Line by ",DifAboveL3," for ", Symbol(),"-",Period());
      PlaySound("timeout.wav");
      firstL3=false;
    }
   }

}


//+------------------------------------------------------------------+
//| Custom indicator iteration function                              |
//+------------------------------------------------------------------+
int start()
  {
   int    counted_bars=IndicatorCounted();
//---- TODO: add your code here
double day_high=0;
double day_low=0;
double yesterday_open=0;
double today_open=0;
double Q=0,S=0,R=0,nQ=0,nD=0,D=0;

int cnt=720;
double cur_day=0;
double prev_day=0;

double rates_d1[2][6];

//---- exit if period is greater than daily charts
if(Period() > 1440)
{
Print("Error - Chart period is greater than 1 day.");
return(-1); // then exit
}

//---- Get new daily prices & calculate pivots

while (cnt!= 0)
{
	cur_day = TimeDay(Time[cnt]- (GMTshift*3600));

	if (prev_day != cur_day)
	{
		yesterday_close = Close[cnt+1];
		today_open = Open[cnt];
		yesterday_high = day_high;
		yesterday_low = day_low;

		day_high = High[cnt];
		day_low  = Low[cnt];

		prev_day = cur_day;
	}

   if (High[cnt]>day_high)
   {
      day_high = High[cnt];
   }
   if (Low[cnt]<day_low)
   {
      day_low = Low[cnt];
   }

	cnt--;

}


D = (day_high - day_low);
Q = (yesterday_high - yesterday_low);
//------ Pivot Points ------

P = (yesterday_high + yesterday_low + yesterday_close)/3;//Pivot
//---- To display all 8 Camarilla pivots remove comment symbols below and
// add the appropriate object functions below
H5 = (yesterday_high/yesterday_low)*yesterday_close;
H4 = ((yesterday_high - yesterday_low)* D4) + yesterday_close;
H3 = ((yesterday_high - yesterday_low)* D3) + yesterday_close;
//H2 = ((yesterday_high - yesterday_low) * D2) + yesterday_close;
//H1 = ((yesterday_high - yesterday_low) * D1) + yesterday_close;

//L1 = yesterday_close - ((yesterday_high - yesterday_low)*(D1));
//L2 = yesterday_close - ((yesterday_high - yesterday_low)*(D2));
L3 = yesterday_close - ((yesterday_high - yesterday_low)*(D3));
L4 = yesterday_close - ((yesterday_high - yesterday_low)*(D4));
L5 = yesterday_close - (H5 - yesterday_close);

if (Fibs)
{
      R = yesterday_high - yesterday_low;//range
      p = (yesterday_high + yesterday_low + yesterday_close)/3;// Standard Pivot
      r1 = p + (R * 0.38);
      r2 = p + (R * 0.62);
      r3 = p + (R * 0.99);
      s1 = p - (R * 0.38);
      s2 = p - (R * 0.62);
      s3 = p - (R * 0.99);
}

//comment on OHLC and daily range

if (Q > 5)
{
	nQ = Q;
}
else
{
	nQ = Q*10000;
}

if (D > 5)
{
	nD = D;
}
else
{
	nD = D*10000;
}

 if (StringSubstr(Symbol(),3,3)=="JPY")
      {
      nQ=nQ/100;
      nD=nD/100;
      }

Comment("High= ",yesterday_high,"    Previous Days Range= ",nQ,"\nLow= ",yesterday_low,"    Current Days Range= ",nD,"\nClose= ",yesterday_close);

//---- Set line labels on chart window
 if (Pivot)
   {

      if(ObjectFind("P label") != 0)
      {
      ObjectCreate("P label", OBJ_TEXT, 0, Time[0], P);
      ObjectSetText("P label", "Pivot", PivotFontSize, "Arial", PivotFontColor);
      }
      else
      {
      ObjectMove("P label", 0, Time[0], P);
      }

//---  Draw  Pivot lines on chart

      if(ObjectFind("P line") != 0)
      {
      ObjectCreate("P line", OBJ_HLINE, 0, Time[40], P);
      ObjectSet("P line", OBJPROP_STYLE, STYLE_DASH);
      ObjectSet("P line", OBJPROP_COLOR, PivotColor);
      }
      else
      {
      ObjectMove("P line", 0, Time[40], P);
      }

  }

  if (Fibs)
  {
      if(ObjectFind("R1 label") != 0)
      {
        ObjectCreate("R1 label", OBJ_TEXT, 0, 0, 0);
        ObjectSetText("R1 label", "Fib R1", FibFontSize, "Arial", FibFontColor);
      }
      else
      {
        ObjectMove("R1 label", 0, Time[0], r1);
      }
      if(ObjectFind("R2 label") != 0)
      {
        ObjectCreate("R2 label", OBJ_TEXT, 0, 0, 0);
        ObjectSetText("R2 label", "Fib R2", FibFontSize, "Arial", FibFontColor);
      }
      else
      {
        ObjectMove("R2 label", 0, Time[0], r2);
      }
      if(ObjectFind("R3 label") != 0)
      {
        ObjectCreate("R3 label", OBJ_TEXT, 0, 0, 0);
        ObjectSetText("R3 label", "Fib R3", FibFontSize, "Arial", FibFontColor);
      }
      else
      {
        ObjectMove("R3 label", 0, Time[0], r3);
      }
      if(ObjectFind("S1 label") != 0)
      {
        ObjectCreate("S1 label", OBJ_TEXT, 0, 0, 0);
        ObjectSetText("S1 label", "Fib S1", FibFontSize, "Arial", FibFontColor);
      }
      else
      {
        ObjectMove("S1 label", 0, Time[0], s1);
      }
      if(ObjectFind("S2 label") != 0)
      {
        ObjectCreate("S2 label", OBJ_TEXT, 0, 0, 0);
        ObjectSetText("S2 label", "Fib S2", FibFontSize, "Arial", FibFontColor);
      }
      else
      {
        ObjectMove("S2 label", 0, Time[0], s2);
      }
      if(ObjectFind("S3 label") != 0)
      {
        ObjectCreate("S3 label", OBJ_TEXT, 0, 0, 0);
        ObjectSetText("S3 label", "Fib S3", FibFontSize, "Arial", FibFontColor);
      }
      else
      {
        ObjectMove("S3 label", 0, Time[0], s3);
      }

//---- Set lines on chart window

      if(ObjectFind("S1 line") != 0)
      {
        ObjectCreate("S1 line", OBJ_HLINE, 0, 0, 0);
        ObjectSet("S1 line", OBJPROP_STYLE, STYLE_DASHDOTDOT);
        ObjectSet("S1 line", OBJPROP_COLOR, FibColor);
      }
      else
      {
        ObjectMove("S1 line", 0, Time[0], s1);
      }
      if(ObjectFind("S2 line") != 0)
      {
        ObjectCreate("S2 line", OBJ_HLINE, 0, 0, 0);
        ObjectSet("S2 line", OBJPROP_STYLE, STYLE_DASHDOTDOT);
        ObjectSet("S2 line", OBJPROP_COLOR, FibColor);
      }
      else
      {
        ObjectMove("S2 line", 0, Time[0], s2);
      }
      if(ObjectFind("S3 line") != 0)
      {
        ObjectCreate("S3 line", OBJ_HLINE, 0, 0, 0);
        ObjectSet("S3 line", OBJPROP_STYLE, STYLE_DASHDOTDOT);
        ObjectSet("S3 line", OBJPROP_COLOR, FibColor);
      }
      else
      {
        ObjectMove("S3 line", 0, Time[0], s3);
      }
      if(ObjectFind("R1 line") != 0)
      {
        ObjectCreate("R1 line", OBJ_HLINE, 0, 0, 0);
        ObjectSet("R1 line", OBJPROP_STYLE, STYLE_DASHDOTDOT);
        ObjectSet("R1 line", OBJPROP_COLOR, FibColor);
      }
      else
      {
        ObjectMove("R1 line", 0, Time[0], r1);
      }
      if(ObjectFind("R2 line") != 0)
      {
        ObjectCreate("R2 line", OBJ_HLINE, 0, 0, 0);
        ObjectSet("R2 line", OBJPROP_STYLE, STYLE_DASHDOTDOT);
        ObjectSet("R2 line", OBJPROP_COLOR, FibColor);
      }
      else
      {
        ObjectMove("R2 line", 0, Time[0], r2);
      }
      if(ObjectFind("R3 line") != 0)
      {
        ObjectCreate("R3 line", OBJ_HLINE, 0, 0, 0);
        ObjectSet("R3 line", OBJPROP_STYLE, STYLE_DASHDOTDOT);
        ObjectSet("R3 line", OBJPROP_COLOR, FibColor);
      }
      else
      {
        ObjectMove("R3 line", 0, Time[0], r3);
      }

  }


// --- THE CAMARILLA ---
   if(ObjectFind("H5 label") != 0)
      {
      ObjectCreate("H5 label", OBJ_TEXT, 0, Time[20], H5);
      ObjectSetText("H5 label", " H5 LB TARGET", CamFontSize, "Arial", CamFontColor);
      }
      else
      {
      ObjectMove("H5 label", 0, Time[20], H5);
      }

      if(ObjectFind("H4 label") != 0)
      {
      ObjectCreate("H4 label", OBJ_TEXT, 0, Time[20], H4);
      ObjectSetText("H4 label", " H4 LONG BREAKOUT", CamFontSize, "Arial", CamFontColor);
      }
      else
      {
      ObjectMove("H4 label", 0, Time[20], H4);
      }

      if(ObjectFind("H3 label") != 0)
      {
      ObjectCreate("H3 label", OBJ_TEXT, 0, Time[20], H3);
      ObjectSetText("H3 label", " H3 SHORT", CamFontSize, "Arial", CamFontColor);
      }
      else
      {
      ObjectMove("H3 label", 0, Time[20], H3);
      }

      if(ObjectFind("L3 label") != 0)
      {
      ObjectCreate("L3 label", OBJ_TEXT, 0, Time[20], L3);
      ObjectSetText("L3 label", " L3 LONG", CamFontSize, "Arial", CamFontColor);
      }
      else
      {
      ObjectMove("L3 label", 0, Time[20], L3);
      }

      if(ObjectFind("L4 label") != 0)
      {
      ObjectCreate("L4 label", OBJ_TEXT, 0, Time[20], L4);
      ObjectSetText("L4 label", " L4 SHORT BREAKOUT", CamFontSize, "Arial", CamFontColor);
      }
      else
      {
      ObjectMove("L4 label", 0, Time[20], L4);
      }

      if(ObjectFind("L5 label") != 0)
      {
      ObjectCreate("L5 label", OBJ_TEXT, 0, Time[20], L5);
      ObjectSetText("L5 label", " L5 SB TARGET", CamFontSize, "Arial", CamFontColor);
      }
      else
      {
      ObjectMove("L5 label", 0, Time[20], L5);
      }

//---- Draw Camarilla lines on Chart
      if(ObjectFind("H5 line") != 0)
      {
      ObjectCreate("H5 line", OBJ_HLINE, 0, Time[40], H5);
      ObjectSet("H5 line", OBJPROP_STYLE, STYLE_SOLID);
      ObjectSet("H5 line", OBJPROP_COLOR, SpringGreen);
      ObjectSet("H5 line", OBJPROP_WIDTH, 1);
      }
      else
      {
      ObjectMove("H5 line", 0, Time[40], H5);
      }

      if(ObjectFind("H4 line") != 0)
      {
      ObjectCreate("H4 line", OBJ_HLINE, 0, Time[40], H4);
      ObjectSet("H4 line", OBJPROP_STYLE, STYLE_SOLID);
      ObjectSet("H4 line", OBJPROP_COLOR, SpringGreen);
      ObjectSet("H4 line", OBJPROP_WIDTH, 1);
      }
      else
      {
      ObjectMove("H4 line", 0, Time[40], H4);
      }

      if(ObjectFind("H3 line") != 0)
      {
      ObjectCreate("H3 line", OBJ_HLINE, 0, Time[40], H3);
      ObjectSet("H3 line", OBJPROP_STYLE, STYLE_SOLID);
      ObjectSet("H3 line", OBJPROP_COLOR, SpringGreen);
      ObjectSet("H3 line", OBJPROP_WIDTH, 2);
      }
      else
      {
      ObjectMove("H3 line", 0, Time[40], H3);
      }

      if(ObjectFind("L3 line") != 0)
      {
      ObjectCreate("L3 line", OBJ_HLINE, 0, Time[40], L3);
      ObjectSet("L3 line", OBJPROP_STYLE, STYLE_SOLID);
      ObjectSet("L3 line", OBJPROP_COLOR, Red);
      ObjectSet("L3 line", OBJPROP_WIDTH, 2);
      }
      else
      {
      ObjectMove("L3 line", 0, Time[40], L3);
      }

      if(ObjectFind("L4 line") != 0)
      {
      ObjectCreate("L4 line", OBJ_HLINE, 0, Time[40], L4);
      ObjectSet("L4 line", OBJPROP_STYLE, STYLE_SOLID);
      ObjectSet("L4 line", OBJPROP_COLOR, Red);
      ObjectSet("L4 line", OBJPROP_WIDTH, 1);
      }
      else
      {
      ObjectMove("L4 line", 0, Time[40], L4);
      }

      if(ObjectFind("L5 line") != 0)
      {
      ObjectCreate("L5 line", OBJ_HLINE, 0, Time[40], L5);
      ObjectSet("L5 line", OBJPROP_STYLE, STYLE_SOLID);
      ObjectSet("L5 line", OBJPROP_COLOR, Red);
      ObjectSet("L5 line", OBJPROP_WIDTH, 1);
      }
      else
      {
      ObjectMove("L5 line", 0, Time[40], L5);
      }

//---- done
   // Now check for Alert

   if (Alerts) DoAlerts();

//----
   return(0);
  }
//+------------------------------------------------------------------+
Sample
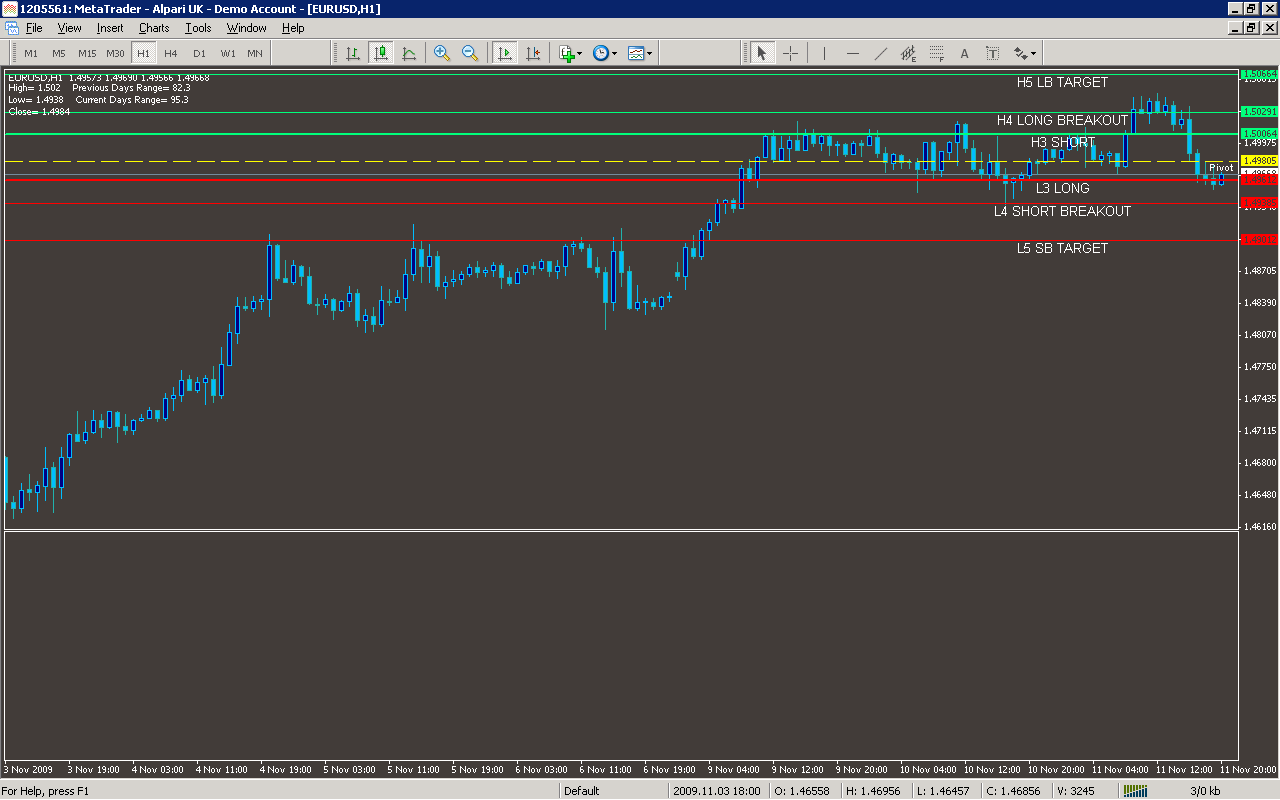
Analysis
Market Information Used:
Series array that contains close prices for each bar
Series array that contains open time of each bar
Series array that contains open prices of each bar
Series array that contains the highest prices of each bar
Series array that contains the lowest prices of each bar
Indicator Curves created:
Indicators Used:
Custom Indicators Used:
Order Management characteristics:
Other Features:
It issuies visual alerts to the screen
It plays sound alerts