//+------------------------------------------------------------------+
//|                                                  Correlation.mq4 |
//|                                               Áåçáîðîäîâ Àëåêñåé |
//|                                                   AlexeiBv@ya.ru |
//+------------------------------------------------------------------+
#property copyright "Áåçáîðîäîâ Àëåêñåé"
#property link      "AlexeiBv@ya.ru"
//----
#property indicator_separate_window
#property indicator_buffers 1
#property indicator_color1 Silver
//----
extern string OtherChart="EURUSD";
extern int n=20;
extern bool UseOpen=true;
extern bool UseClose=false;
extern bool UseHigh=false;
extern bool UseLow=false;
extern int CalcBars=400;
//----
double Buffer[];
//+------------------------------------------------------------------+
//| Custom indicator initialization function                         |
//+------------------------------------------------------------------+
int init()
  {
//---- indicators
   string short_name;
//---- 1 additional buffer used for counting.
   IndicatorBuffers(1);
   IndicatorDigits(Digits);
//---- indicator line
   SetIndexStyle(0,DRAW_HISTOGRAM);
   SetIndexBuffer(0,Buffer);
   //  SetIndexBuffer(1,TempBuffer);
//---- name for DataWindow and indicator subwindow label
   short_name="Correlation("+n+")";
   IndicatorShortName(short_name);
   SetIndexLabel(0,short_name);
//----
   return(0);
  }
//+------------------------------------------------------------------+
//| Custom indicator deinitialization function                       |
//+------------------------------------------------------------------+
int deinit()
  {
//----
//----
   return(0);
  }
//+------------------------------------------------------------------+
//| Custom indicator iteration function                              |
//+------------------------------------------------------------------+
int start()
  {
   // Print("True "+true+" false "+false  );
   int i,k,counted_bars=IndicatorCounted();
   double sx,sy,x,y,cor1,cor2,cor3;
//----
   if(Bars<=n) return(0);
//----
   int limit=Bars-counted_bars;
   if(counted_bars>0) limit++;
   for(i=0; i<CalcBars; i++)
     {
      sx=0; sy=0;
      for(k=0; k<n; k++)
        {
         if((UseOpen+UseClose+UseHigh+UseLow)==0) x=0;
         else x=(Open[i+k]*UseOpen+Close[i+k]*UseClose+High[i+k]*UseHigh+Low[i+k]*UseLow)/(UseOpen+UseClose+UseHigh+UseLow);
         if((UseOpen+UseClose+UseHigh+UseLow)==0) y=0;
         else y=(iOpen(OtherChart,0,i+k)*UseOpen+iClose(OtherChart,0,i+k)*UseClose+iHigh(OtherChart,0,i+k)*UseHigh+iLow(OtherChart,0,i+k)*UseLow)/(UseOpen+UseClose+UseHigh+UseLow);
         sx+=x;sy+=y;
        }
      sx/=n;sy/=n;
      cor1=0;cor2=0;cor3=0;
      for(k=0; k<n; k++)
        {
         if((UseOpen+UseClose+UseHigh+UseLow)==0) x=0;
         else x=(Open[i+k]*UseOpen+Close[i+k]*UseClose+High[i+k]*UseHigh+Low[i+k]*UseLow)/(UseOpen+UseClose+UseHigh+UseLow);
         if((UseOpen+UseClose+UseHigh+UseLow)==0) y=0;
         else y=(iOpen(OtherChart,0,i+k)*UseOpen+iClose(OtherChart,0,i+k)*UseClose+iHigh(OtherChart,0,i+k)*UseHigh+iLow(OtherChart,0,i+k)*UseLow)/(UseOpen+UseClose+UseHigh+UseLow);
         cor1+=(x-sx)*(y-sy);
         cor2+=(x-sx)*(x-sx);
         cor3+=(y-sy)*(y-sy);
        }
      Buffer[i]=cor1/MathSqrt(cor2)/MathSqrt(cor3);
     }
//----
   return(0);
  }
//+------------------------------------------------------------------+
Sample
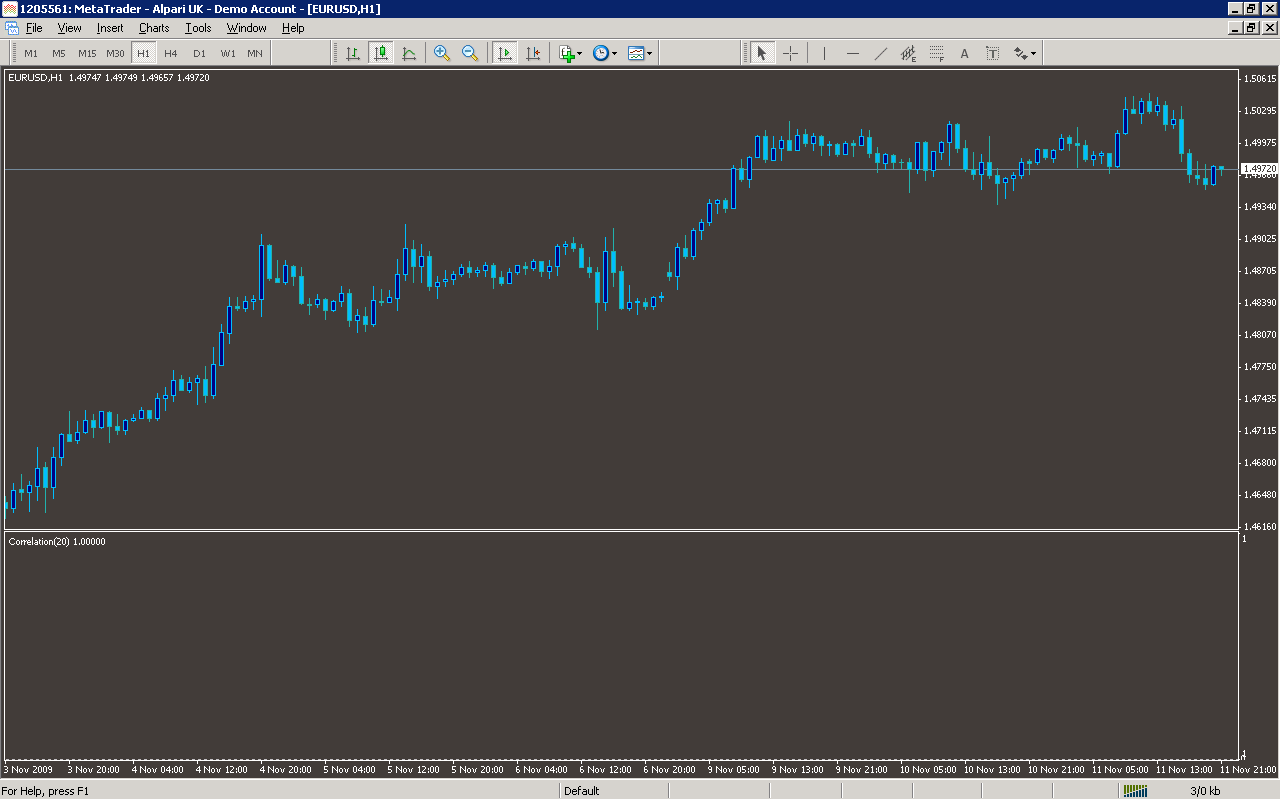
Analysis
Market Information Used:
Series array that contains close prices for each bar
Series array that contains the highest prices of each bar
Series array that contains the lowest prices of each bar
Series array that contains open prices of each bar
Indicator Curves created:
Implements a curve of type DRAW_HISTOGRAM
Indicators Used:
Custom Indicators Used:
Order Management characteristics:
Other Features: