//+------------------------------------------------------------------+
//| DailyHL.mq4 |
//| These are the days highest high and lowest low |
//| Written by: Ice |
//| |
//+------------------------------------------------------------------+
#property copyright "2005 Free software for trader"

#property indicator_chart_window
#property indicator_buffers 2

#property indicator_color1 Blue
#property indicator_color2 Red


//---- input parameters\

datetime BT[];
double YesterdayHigh[50];
double YesterdayLow[50];
double YesterdayClose[50];
//---- buffers

double HighArray[];
double LowArray[];
//+------------------------------------------------------------------+
//| Custom indicator initialization function |
//+------------------------------------------------------------------+
int init()
{
//---- indicators
// Pivot
SetIndexStyle(0,DRAW_LINE);
SetIndexBuffer(0,HighArray);
IndicatorShortName("High Line");

// Resistance 1
SetIndexStyle(1,DRAW_LINE);
SetIndexBuffer(1,LowArray);
SetIndexLabel(3,"Low Line");

return(0);
}
//+------------------------------------------------------------------+
//| Custor indicator deinitialization function |
//+------------------------------------------------------------------+
int deinit()
{
return(0);
}
//+------------------------------------------------------------------+
//| Custom indicator iteration function |
//+------------------------------------------------------------------+
int start()
{
int counted_bars=IndicatorCounted();

ArrayResize(BT, Bars); Print("Bars = " + Bars);
// Fill BT with bar open TIME
ArrayCopySeries(BT, MODE_TIME);
// Fill temp arrays with High, Low and Close prices per day
ArrayCopySeries(YesterdayHigh, MODE_HIGH, Symbol(), PERIOD_D1);
ArrayCopySeries(YesterdayLow, MODE_LOW, Symbol(), PERIOD_D1);
ArrayCopySeries(YesterdayClose, MODE_CLOSE, Symbol(), PERIOD_D1);

int od = 0;
int dd = 0;


double HighLine;
double LowLine;

//Cycle through all the bars and fill the indicator bars with the Pivot point values
for (int i = 0; i <= Bars; i++) {
if (TimeDay(BT[i]) != od) {
dd++;
HighLine = YesterdayHigh[dd-1];
LowLine = YesterdayLow[dd-1];
od = TimeDay(BT[i]);
}

HighArray[i] = HighLine;
LowArray[i]=LowLine;
}

//----
return(0);
}
//+------------------------------------------------------------------+
Sample
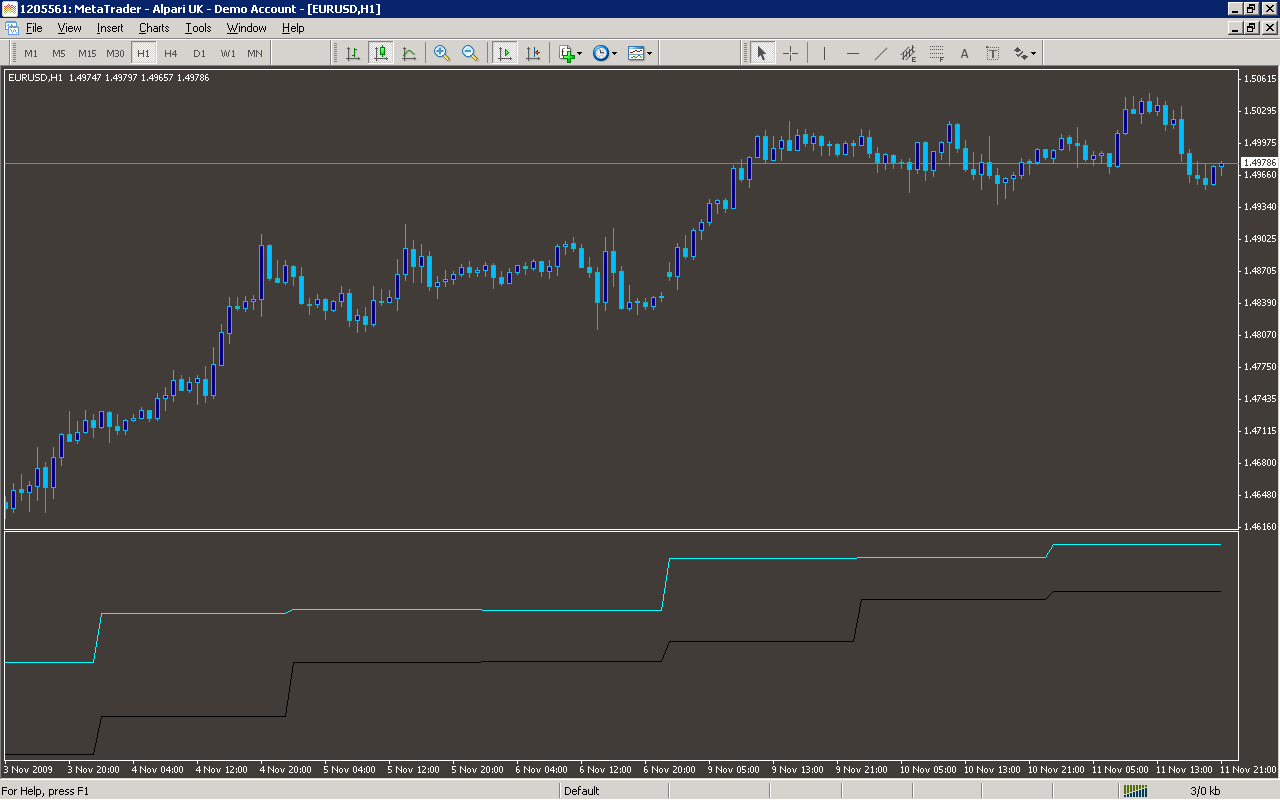
Analysis
Market Information Used:
Series array that contains the highest prices of each bar
Series array that contains the lowest prices of each bar
Series array that contains close prices for each bar
Indicator Curves created:
Implements a curve of type DRAW_LINE
Indicators Used:
Custom Indicators Used:
Order Management characteristics:
Other Features: