//+------------------------------------------------------------------+
//|                                                DailyBreakout.mq4 |
//|                                   Copyright © 2008, Robert Hill. |
//+------------------------------------------------------------------+
#property copyright "Copyright © 2008, Robert Hill"
#property link      "NONE"

#property indicator_chart_window
//---- input parameters
extern bool Alerts = false;
extern int  GMTshift = 0;
extern int LabelShift = 20;
extern int LineShift = 40;
extern string  pd = "PipsAboveBelowSR for Alert";
extern int PipDistance = 1;
extern color StandardFontColor = White;
extern int StandardFontSize = 8;
extern color SupportColor = Red;
extern color ResistanceColor = Lime;

datetime LabelShiftTime, LineShiftTime;

double yesterday_high=0;
double yesterday_low=0;
double LastHigh,LastLow,x;
double R1=0;
double S1=0;
bool firstS1=true;
bool firstR1=true;
double myPoint;


//+------------------------------------------------------------------+
//| Custom indicator initialization function                         |
//+------------------------------------------------------------------+
int init()
  {
//---- indicators
     myPoint = SetPoint(Symbol());
//----
   return(0);
  }
//+------------------------------------------------------------------+
//| Custor indicator deinitialization function                       |
//+------------------------------------------------------------------+
int deinit()
  {
//---- TODO: add your code here
//----
ObjectDelete("R1 Label");
ObjectDelete("R1 Line");
ObjectDelete("S1 Label");
ObjectDelete("S1 Line");

   return(0);
  }

double SetPoint(string mySymbol)
{
   double mPoint, myDigits;

   myDigits = MarketInfo (mySymbol, MODE_DIGITS);
   if (myDigits < 4)
      mPoint = 0.01;
   else
      mPoint = 0.0001;

   return(mPoint);
}

int DoAlerts()
{
   double DifAboveR1,PipsLimit;
   double DifBelowS1;

   DifBelowS1 = S1 - Close[0];
   DifAboveR1 = Close[0] - R1;
   PipsLimit = PipDistance * myPoint;

   if (DifBelowS1 > PipsLimit) firstS1 = true;
   if (DifBelowS1 <= PipsLimit && DifBelowS1 > 0)
   {
    if (firstS1)
    {
      Alert("Below S1 Line by ",DifBelowS1, " for ", Symbol(),"-",Period());
      PlaySound("alert.wav");
      firstS1=false;
    }
   }

   if (DifAboveR1 > PipsLimit) firstR1 = true;
   if (DifAboveR1 <= PipsLimit && DifAboveR1 > 0)
   {
    if (firstR1)
    {
      Alert("Above R1 Line by ",DifAboveR1," for ", Symbol(),"-",Period());
      Sleep(2000);
      PlaySound("timeout.wav");
      firstR1=false;
    }
   }

}


//+------------------------------------------------------------------+
//| Custom indicator iteration function                              |
//+------------------------------------------------------------------+
int start()
  {
   int    counted_bars=IndicatorCounted();
//---- TODO: add your code here

double day_high=0;
double day_low=0;
double yesterday_open=0;
double today_open=0;
double cur_day=0;
double prev_day=0;

int cnt=720;

//---- exit if period is greater than 4 hr charts
if(Period() > 240)
{
Print("Error - Chart period is greater than 4 hr.");
return(-1); // then exit
}

//---- Get new daily prices & calculate pivots
 cur_day=0;
 prev_day=0;


//---- Get new daily prices & calculate pivots

while (cnt!= 0)
{
	cur_day = TimeDay(Time[cnt]- (GMTshift*3600));

	if (prev_day != cur_day)
	{
		yesterday_high = day_high;
		yesterday_low = day_low;

		day_high = High[cnt];
		day_low  = Low[cnt];

		prev_day = cur_day;
	}

   if (High[cnt]>day_high)
   {
      day_high = High[cnt];
   }
   if (Low[cnt]<day_low)
   {
      day_low = Low[cnt];
   }

	cnt--;

}


S1 = yesterday_low;
R1 = yesterday_high;

LabelShiftTime = Time[LabelShift];
LineShiftTime = Time[LineShift];
//---- Set line labels on chart window

      DisplayLabel("R1 label", "R1", R1, StandardFontSize, StandardFontColor);
      DisplayLabel("S1 label", "S1", S1, StandardFontSize, StandardFontColor);

//---  Draw  Pivot lines on chart

      DisplayLine("S1 line", S1, 0, STYLE_DASHDOTDOT, SupportColor);
      DisplayLine("R1 line", R1, 0, STYLE_DASHDOTDOT, ResistanceColor);

//---- done
   // Now check for Alert

   if (Alerts) DoAlerts();

//----
   return(0);
  }

//---- Set line labels on chart window
void DisplayLabel(string LabelName, string LabelText, double LabelPos, int LabelFontSize, color LabelColor)
{
      if(ObjectFind(LabelName) != 0)
      {
        ObjectCreate(LabelName, OBJ_TEXT, 0, LabelShiftTime, LabelPos);
        ObjectSetText(LabelName, LabelText, LabelFontSize, "Arial", LabelColor);
      }
      else
      {
        ObjectMove(LabelName, 0, LabelShiftTime, LabelPos);
      }
}

//---  Draw  Pivot lines on chart
void DisplayLine(string LineName, double LinePos, int LineWidth, int LineStyle, color LineColor)
{
      if(ObjectFind(LineName) != 0)
      {
      ObjectCreate(LineName, OBJ_HLINE, 0, LineShiftTime, LinePos);
      ObjectSet(LineName, OBJPROP_STYLE, LineStyle);
      ObjectSet(LineName, OBJPROP_COLOR, LineColor);
      if (LineWidth > 0) ObjectSet(LineName, OBJPROP_WIDTH, LineWidth);
      }
      else
      {
      ObjectMove(LineName, 0, LineShiftTime, LinePos);
      }
}
//+------------------------------------------------------------------+
Sample
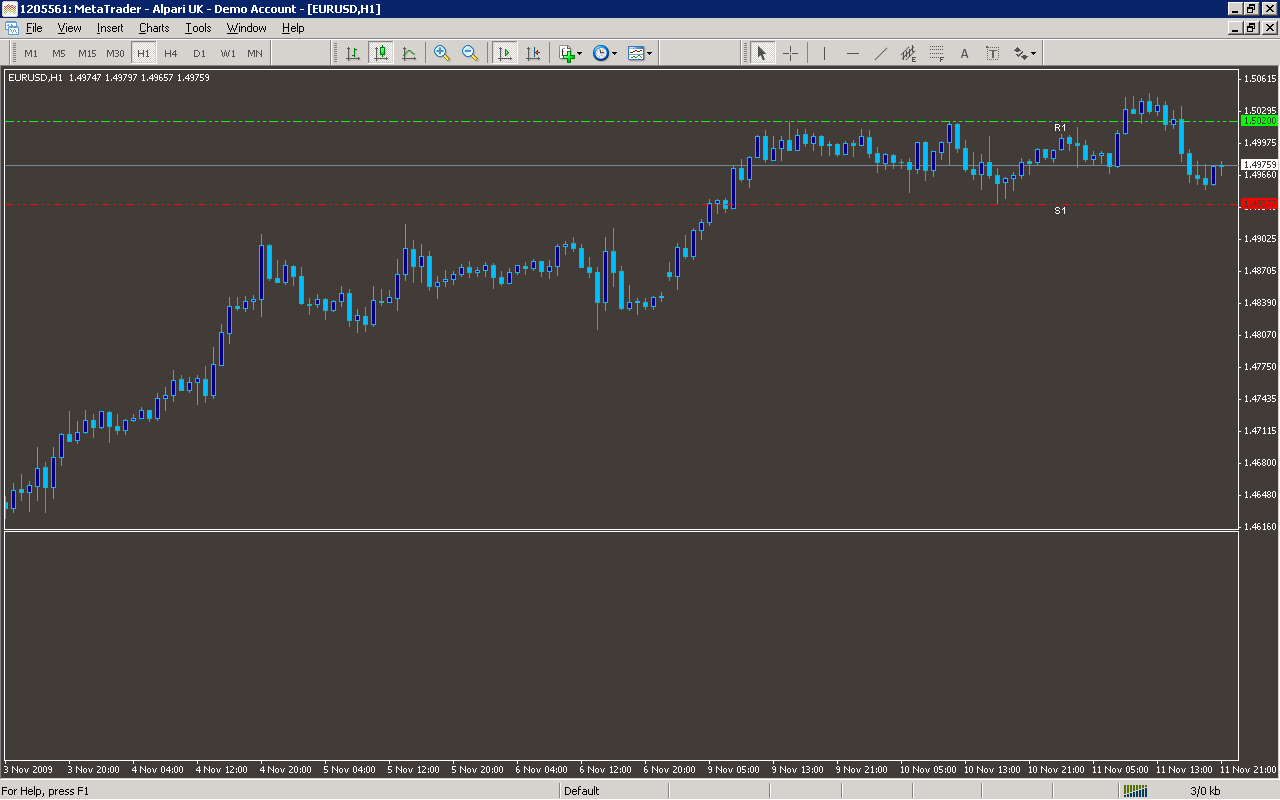
Analysis
Market Information Used:
Series array that contains close prices for each bar
Series array that contains open time of each bar
Series array that contains the highest prices of each bar
Series array that contains the lowest prices of each bar
Indicator Curves created:
Indicators Used:
Custom Indicators Used:
Order Management characteristics:
Other Features:
It issuies visual alerts to the screen
It plays sound alerts