//+------------------------------------------------------------------+
//|                                                   DayChannel.mq4 |
//|                                                       Ãîøà Øìåëü |
//|                                           http://www.system32.ru |
//+------------------------------------------------------------------+
#property copyright "Ãîøà Øìåëü"
#property link      "http://www.system32.ru"

#property indicator_chart_window
#property indicator_buffers 3
#property indicator_color1 Red
#property indicator_color2 Lime
#property indicator_color3 Blue

double shifthigh[];
double shiftlow[];
double shiftaver[];
//+------------------------------------------------------------------+
//| Custom indicator initialization function                         |
//+------------------------------------------------------------------+
int init()
  {

SetIndexStyle(0,DRAW_LINE, 0,2);
SetIndexBuffer(0,shifthigh);
SetIndexLabel(0,"Up Channel");
SetIndexDrawBegin(0,0);

SetIndexStyle(1,DRAW_LINE, 0,2);
SetIndexBuffer(1,shiftlow);
SetIndexLabel(1,"Down Channel");
SetIndexDrawBegin(1,0);

SetIndexStyle(2,DRAW_LINE, 0,2);
SetIndexBuffer(2,shiftaver);
SetIndexLabel(2,"Average Channel");
SetIndexDrawBegin(2,0);
//----
   return(0);
  }
//+------------------------------------------------------------------+
//| Custor indicator deinitialization function                       |
//+------------------------------------------------------------------+
 int deinit()
  {
//----

//----
   return(0);
  }
//+------------------------------------------------------------------+
//| Custom indicator iteration function                              |
//+------------------------------------------------------------------+
int start()
  {
int i;
double LowLine=0;
double HighLine=0;
double AverLine=0;

//----

int ww=0;
for (i=(Bars-1);i>0;i--)
      {
      if (((TimeHour(Time[i])== 23) && (TimeMinute(Time[i]) < 59))
         || ((TimeDayOfWeek(Time[i])== 5) && (TimeHour(Time[i])== 22) && (TimeMinute(Time[i]) < 59)))
        ww=0;
	   if (TimeHour(Time[i])== 0 && TimeMinute(Time[i]) >= 0 && TimeMinute(Time[i]) <= 30 && ww == 0)
	     {
	     LowLine=iLow(Symbol(),NULL,i);
	     HighLine=iHigh(Symbol(),NULL,i);
	     ww=1;
	     }
	   else
	     {
	     if (iLow(Symbol(),NULL,i)  < LowLine)   LowLine = iLow(Symbol(),NULL,i);
	     if (iHigh(Symbol(),NULL,i) > HighLine) HighLine = iHigh(Symbol(),NULL,i);
	     }
	   AverLine=LowLine+(HighLine-LowLine)/2;

		shiftlow[i]=LowLine;
		shifthigh[i]=HighLine;
		shiftaver[i]=AverLine;
		}

Comment(" Õàé - ", HighLine,";   Ëîó - ",LowLine, ";   ÄÑ - ",AverLine,";   Øèðèíà êàíàëà=",(HighLine-LowLine)*(1/Point));
//----
   return(0);
  }
//+------------------------------------------------------------------+
Sample
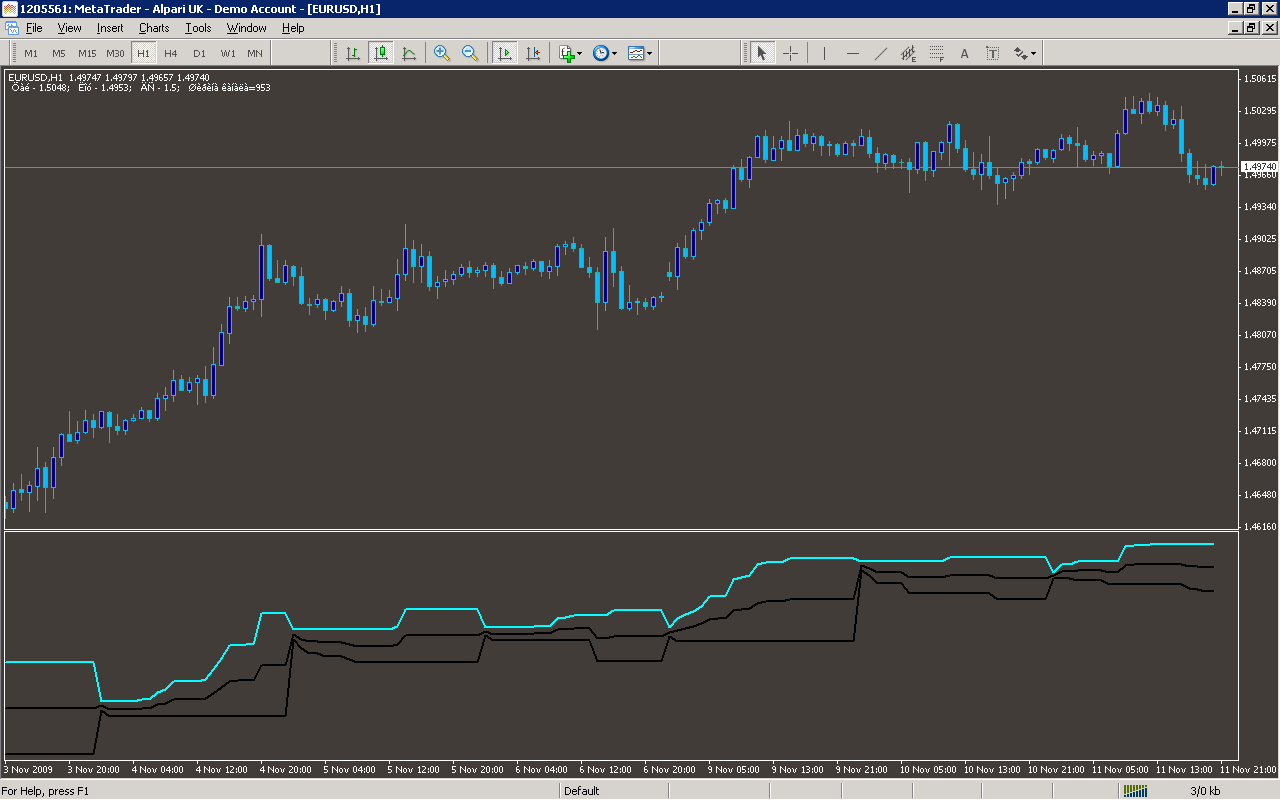
Analysis
Market Information Used:
Series array that contains open time of each bar
Series array that contains the lowest prices of each bar
Series array that contains the highest prices of each bar
Indicator Curves created:
Implements a curve of type DRAW_LINE
Indicators Used:
Custom Indicators Used:
Order Management characteristics:
Other Features: