//+------------------------------------------------------------------+
//|        DM.mq4                                                    |
//|        AlexP conversion only                                     |
//|        thanks Ramdass   and of course Finware.ru                 |
//+------------------------------------------------------------------+
#property copyright "Copyright © 2005, MetaQuotes Software Corp."
#property link      "http://www.metaquotes.net"
//----
#property indicator_chart_window
#property indicator_buffers 2
#property indicator_color1 Blue
#property indicator_color2 Red
//----
extern int CountBars=300;
//---- buffers
double UPBuffer[];
double DownBuffer[];
//+------------------------------------------------------------------+
//| Custom indicator initialization function                         |
//+------------------------------------------------------------------+
int init()
  {
   string short_name;
//---- indicator line
   IndicatorBuffers(2);
   SetIndexStyle(0,DRAW_ARROW);
   SetIndexArrow(0,241);
   SetIndexBuffer(0,UPBuffer);
   SetIndexStyle(1,DRAW_ARROW);
   SetIndexArrow(1,242);
   SetIndexBuffer(1,DownBuffer);
//----
   return(0);
  }
//+------------------------------------------------------------------+
//| SATLs                                                            |
//+------------------------------------------------------------------+
int start()
  {
   SetIndexDrawBegin(0,Bars-CountBars+64);
   SetIndexDrawBegin(1,Bars-CountBars+64);
   int i,counted_bars=IndicatorCounted();
   double c2, c1, c0, c11, l2, l1, l0, l11, h2, h1, h0, h11,val1, val2, i1;
   bool trend,old;
//----
   if(Bars<=64) return(0);
//---- initial zero
   if(counted_bars<64)
     {
      for(i=1;i<=0;i++) UPBuffer[CountBars-i]=0.0;
      for(i=1;i<=0;i++) DownBuffer[CountBars-i]=0.0;
     }
//----
   i=CountBars-64-1;
   // if(counted_bars>=64) i=Bars-counted_bars-1;
   while(i>=0)
     {
      c2=iClose(Symbol(),NULL,i+4);
      c1=iClose(Symbol(),NULL,i+3);
      c0=iClose(Symbol(),NULL,i+2);
      c11=iClose(Symbol(),NULL,i+1);
      l2=iLow(Symbol(),NULL,i+4);
      l1=iLow(Symbol(),NULL,i+3);
      l0=iLow(Symbol(),NULL,i+2);
      l11=iLow(Symbol(),NULL,i+1);
      h2=iHigh(Symbol(),NULL,i+4);
      h1=iHigh(Symbol(),NULL,i+3);
      h0=iHigh(Symbol(),NULL,i+2);
      h11=iHigh(Symbol(),NULL,i+1);
//----
      UPBuffer[i]=0.0; DownBuffer[i]=0.0;
//----
      if (l2>l0 && l1>l0 && l0<=l11 && c2>c1 && c1>c0 && c0<c11) trend=true; // óñëîâèå äëÿ áàé
      if (h2<h0 && h1<h0 && h0>=h11 && c2<c1 && c1<c0 && c0>c11) trend=false;
      if ((! trend==old) && trend==true) UPBuffer[i]=Low[i]-5*Point;
      if ((! trend==old) && trend==false) DownBuffer[i]=High[i]+5*Point;
      old=trend;
      i--;
     }
   return(0);
  }
//+------------------------------------------------------------------+
Sample
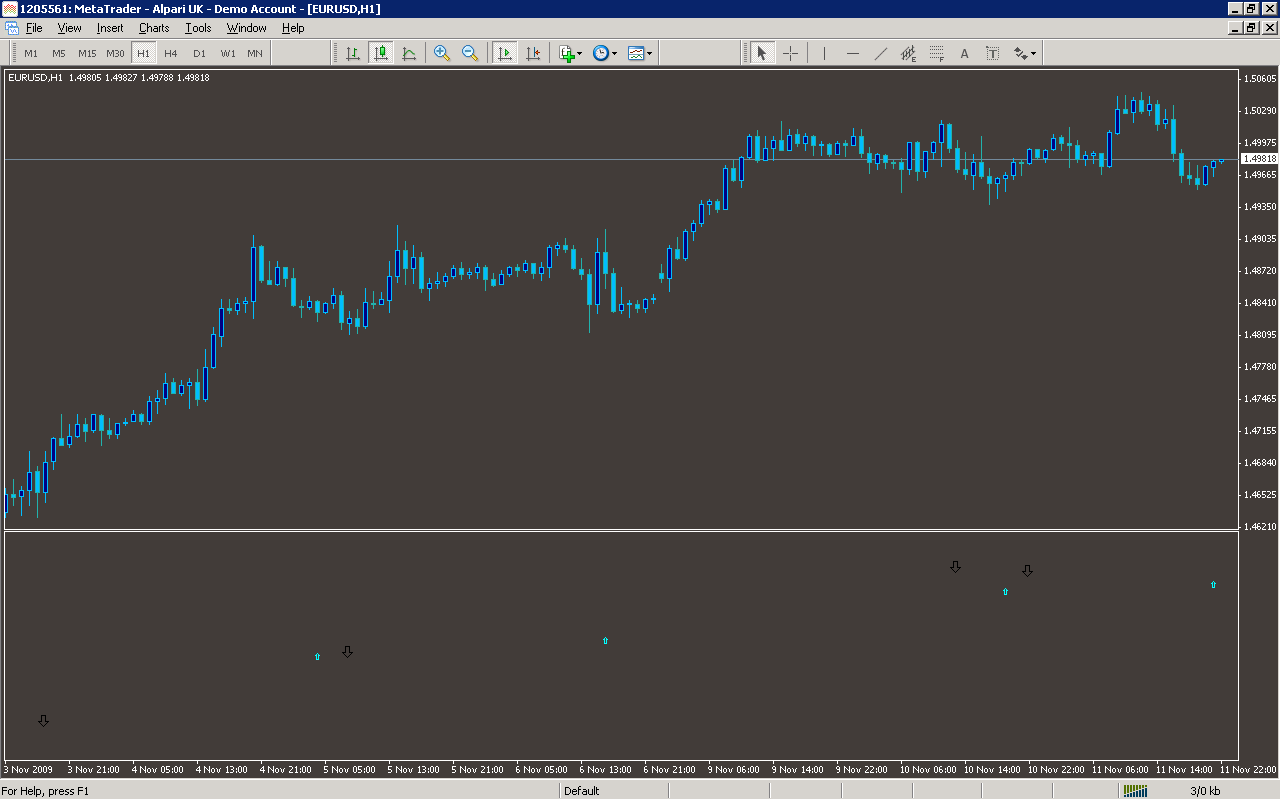
Analysis
Market Information Used:
Series array that contains close prices for each bar
Series array that contains the lowest prices of each bar
Series array that contains the highest prices of each bar
Indicator Curves created:
Implements a curve of type DRAW_ARROW
Indicators Used:
Custom Indicators Used:
Order Management characteristics:
Other Features: