//+------------------------------------------------------------------+
//|                      Donchian Channels - Generalized version.mq4 |
//|                         Copyright © 2005, Luis Guilherme Damiani |
//|                                      http://www.damianifx.com.br |
//+------------------------------------------------------------------+
#property copyright "Copyright © 2005, Luis Guilherme Damiani"
#property link      "http://www.damianifx.com.br"
//----
#property indicator_chart_window
#property indicator_buffers 2
#property indicator_color1 Magenta
#property indicator_color2 SteelBlue
//---- input parameters
extern int       Periods=24;
extern int       Extremes=3;
extern int       Margins=-2;
extern int       Advance=0;
extern int       max_bars=700;
//---- buffers
double ExtMapBuffer1[];
double ExtMapBuffer2[];
//+------------------------------------------------------------------+
//| Custom indicator initialization function                         |
//+------------------------------------------------------------------+
int init()
  {
//---- indicators
   SetIndexStyle(0,DRAW_LINE,1,2);
   SetIndexBuffer(0,ExtMapBuffer1);
   SetIndexStyle(1,DRAW_LINE,1,2);
   SetIndexBuffer(1,ExtMapBuffer2);
//----
   IndicatorShortName("DoC("+Periods+")");
//----
   return(0);
  }
//+------------------------------------------------------------------+
//| Custor indicator deinitialization function                       |
//+------------------------------------------------------------------+
int deinit()
  {
//----
//----
   return(0);
  }
//+------------------------------------------------------------------+
//| Custom indicator iteration function                              |
//+------------------------------------------------------------------+
int start()
  {
   int    fixed_bars=IndicatorCounted();
//----
   //int shift=0;//, cnt(0), loopbegin(0);
   double smin=0, smax=0, SsMax=0, SsMin=0;
   //Variables : bar(0), prevbars(0), start(0), cs(0), prevcs(0),commodt(0);
   if(max_bars==0) max_bars=Bars;
//----
   for(int shift=0;shift< max_bars;shift++)
     {
      if (Extremes ==1)
        {
         SsMax=High[Highest(NULL,0,MODE_HIGH,Periods,shift)];
         SsMin=Low[Lowest(NULL,0,MODE_LOW,Periods,shift)];
        }
      else if (Extremes==3)
           {
            SsMax=(Open[Highest(NULL,0,MODE_OPEN,Periods,shift)]+High[Highest(NULL,0,MODE_HIGH,Periods,shift)])/2;
            SsMin=(Open[Lowest(NULL,0,MODE_OPEN,Periods,shift)]+Low[Lowest(NULL,0,MODE_LOW,Periods,shift)])/2;
           }
         else
           {
            SsMax=Open[Highest(NULL,0,MODE_OPEN,Periods,shift)];
            SsMin=Open[Lowest(NULL,0,MODE_OPEN,Periods,shift)];
           }
      smin=SsMin+(SsMax-SsMin)*Margins/100;
      smax=SsMax-(SsMax-SsMin)*Margins/100;
      ExtMapBuffer1[shift-Advance]=smin;
      ExtMapBuffer2[shift-Advance]=smax;
     }
//----
   return(0);
  }
//+------------------------------------------------------------------+
Sample
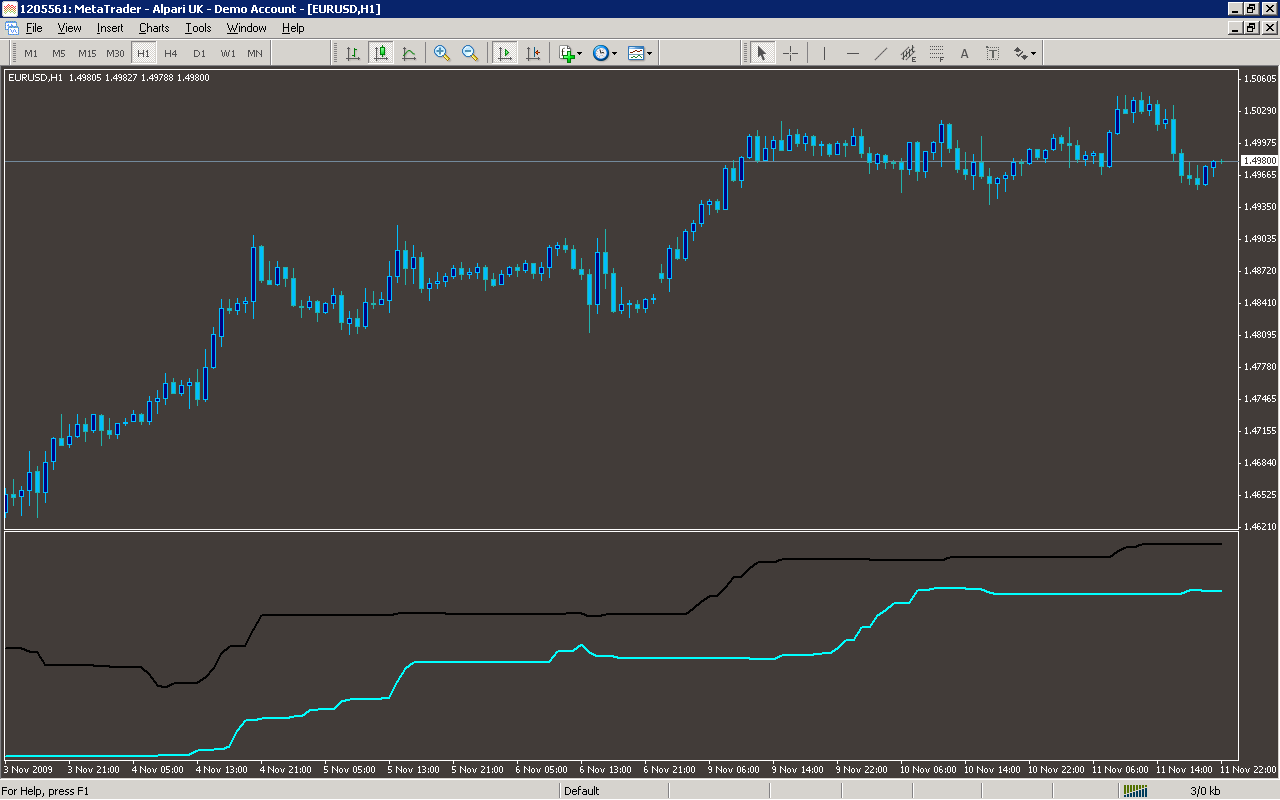
Analysis
Market Information Used:
Series array that contains the highest prices of each bar
Series array that contains the lowest prices of each bar
Series array that contains open prices of each bar
Indicator Curves created:
Implements a curve of type DRAW_LINE
Indicators Used:
Custom Indicators Used:
Order Management characteristics:
Other Features: