//+------------------------------------------------------------------+
//| DT-ZigZag-ATR.mq4 |
//+------------------------------------------------------------------+
#property copyright "Copyright © 2005, klot"
#property link "klot@mail.ru"

#property indicator_chart_window
#property indicator_buffers 2
#property indicator_color1 Red
#property indicator_color2 Blue
//---- input parameters
extern int depth=12;
extern int perATR=12;
extern double k=2;
//---- buffers
double ExtMapBuffer1[];
double ExtMapBuffer2[];
//+------------------------------------------------------------------+
//| Custom indicator initialization function |
//+------------------------------------------------------------------+
int init()
{
//---- indicators
SetIndexStyle(0,DRAW_ARROW);
SetIndexBuffer(0,ExtMapBuffer1);
SetIndexArrow(0,159);
SetIndexStyle(1,DRAW_ARROW);
SetIndexBuffer(1,ExtMapBuffer2);
SetIndexArrow(1,159);
//----
return(0);
}
//+------------------------------------------------------------------+
//| Custor indicator deinitialization function |
//+------------------------------------------------------------------+
int deinit()
{
//----

//----
return(0);
}
//+------------------------------------------------------------------+
//| Custom indicator iteration function |
//+------------------------------------------------------------------+
int start()

{
int limit, bigshift;
int counted_bars=IndicatorCounted();
double zigzag1,atr1;
//----
// if (counted_bars<0) return(-1);

if (counted_bars>0) counted_bars--;

limit=Bars-counted_bars+100;

for (int i=limit; i>0; i--)
{
for (int cnt=i; cnt<(100+i); cnt++)
{
zigzag1=iCustom(NULL,0,"ZigZag",depth,5,3,0,cnt+1);
if ( zigzag1!=0 ) break;
}

atr1=iATR(NULL,0,perATR,i);

if ( iHigh(NULL,0,i+1)<=zigzag1 ) ExtMapBuffer2[i]=iLow(NULL,0,i)+k*atr1; else ExtMapBuffer2[i]=0.0;
if ( iLow(NULL,0,i+1)>=zigzag1 ) ExtMapBuffer1[i]=iHigh(NULL,0,i)-k*atr1; else ExtMapBuffer1[i]=0.0;

}
Comment ("zigzag1 = ",zigzag1," limit = ",limit );
//----
return(0);
}
//+------------------------------------------------------------------+
Sample
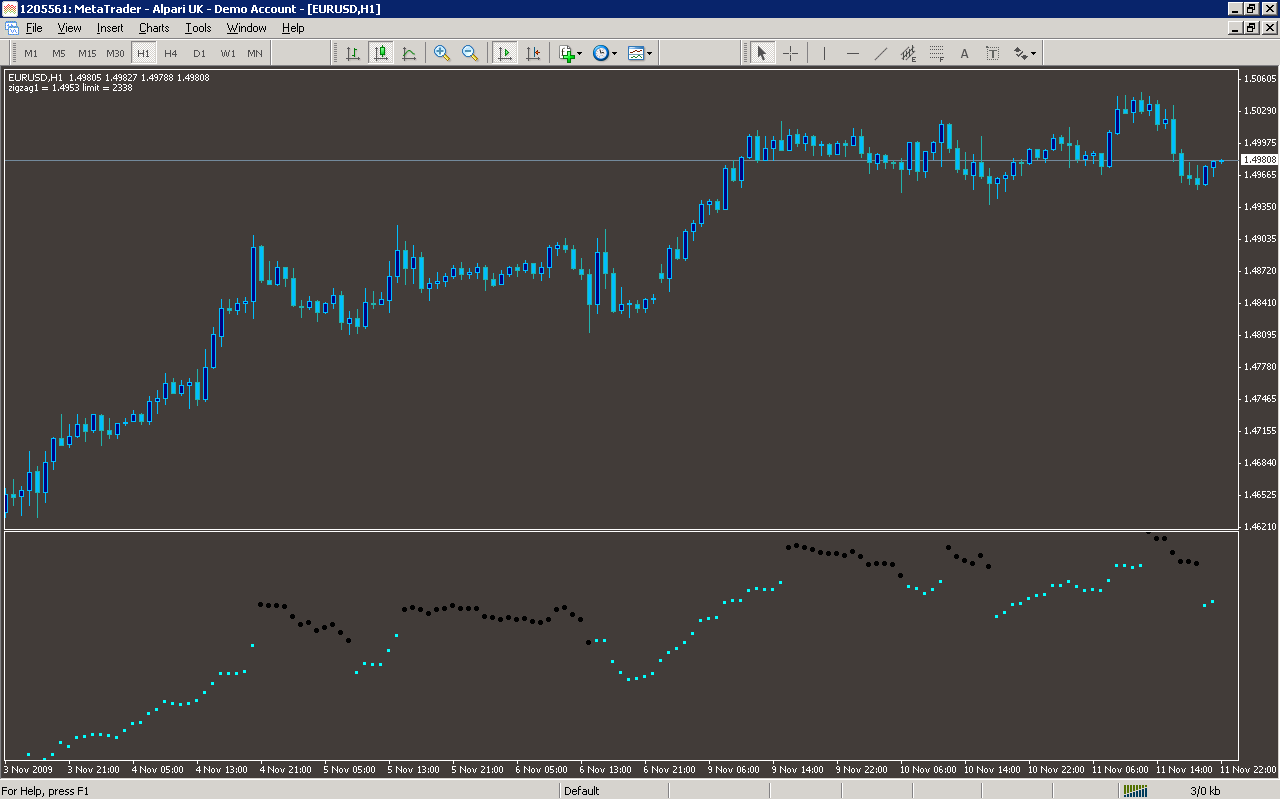
Analysis
Market Information Used:
Series array that contains the highest prices of each bar
Series array that contains the lowest prices of each bar
Indicator Curves created:
Implements a curve of type DRAW_ARROW
Indicators Used:
Indicator of the average true range
Custom Indicators Used:
ZigZag
Order Management characteristics:
Other Features: