/*

Original Formula

WH:=HHV(HIGH,5);
WL:=LLV(LOW,5);
WBP:=(HHV(HIGH,5)+LLV(LOW,5)+CLOSE)/3;

RBAND:=VALUEWHEN(1,CROSS(MOV(WBP,25,S),WBP),
HHV(WH,25));


SBAND:=VALUEWHEN(1,CROSS(WBP,MOV(WBP,25,S)),
LLV(WL,25));

MSWNG:=(RBAND+SBAND)/2;

*/


#property indicator_chart_window
#property indicator_buffers 3
#property indicator_color1 Red
#property indicator_color2 Green
#property indicator_color3 Gray

//---- input parameters
extern int ShortPeriod=5;
extern int LongPeriod=25;

//---- buffers  WHH=HHV(WH,25);WLL=LLV(WL,25);WBP_MA=MOV(WBP,25,S)
double S[];
double R[];
double MS[];
double WBP[],WBP_MA[];


//+------------------------------------------------------------------+
//| Custom indicator initialization function                         |
//+------------------------------------------------------------------+
int init()
  {
   string short_name;
//---- 3 additional buffers are used for counting.
   IndicatorBuffers(5);
//---- name for DataWindow and indicator subwindow label


   SetIndexBuffer(3, WBP);

   SetIndexBuffer(4, WBP_MA);


//----
   SetIndexStyle(0,DRAW_LINE,STYLE_SOLID,2);
   SetIndexBuffer(0, R);
   SetIndexStyle(1,DRAW_LINE,STYLE_SOLID,2);SetIndexBuffer(1, S);
   SetIndexStyle(2,DRAW_LINE,STYLE_DASHDOT,2);SetIndexBuffer(2, MS);
   short_name="Dynamic Support/Resistance";
   IndicatorShortName(short_name);
   SetIndexLabel(0,"Dynamic Resistance");
   SetIndexLabel(1,"Dynamic Support");
   SetIndexLabel(2,"MeanSwing");
   SetIndexDrawBegin(0,LongPeriod);
 SetIndexDrawBegin(1,LongPeriod);
  SetIndexDrawBegin(2,LongPeriod);

//----
   return(0);
  }
//+------------------------------------------------------------------+
//| Dynamic Support/Resistance                                        |
//+------------------------------------------------------------------+
int start()
  {
   int    i,k,counted_bars=IndicatorCounted();

   if(Bars<=LongPeriod) return(0);
//---- initial zero

//---- last counted bar will be recounted
   int limit=Bars-counted_bars;
   if(counted_bars>0) limit++; else { i=limit;
            {R[i]=High[i];S[i]=Low[i];}
          }

//---- WH,WL,WBP calculation

   for(i=0; i<limit; i++)
      WBP[i] = (High[Highest(NULL,0,MODE_HIGH,ShortPeriod,i)] + Low[Lowest(NULL,0,MODE_LOW,ShortPeriod,i)] + Close[i])/3;


//---- WBP MA calculation
for(i=0; i<limit; i++)
WBP_MA[i]=iMAOnArray(WBP,Bars,LongPeriod,0,MODE_SMA,i);


//---- Drawing Lines
for(i=limit-1; i>=0; i--)
  if (WBP[i+1]>WBP_MA[i+1] && WBP[i]<WBP_MA[i])
      R[i]=High[Highest(NULL,0,MODE_HIGH,ShortPeriod+LongPeriod,i)];
        else R[i]=R[i+1];
for(i=limit-1; i>=0; i--)
   if (WBP[i+1]<WBP_MA[i+1] && WBP[i]>WBP_MA[i])
      S[i]=Low[Lowest(NULL,0,MODE_LOW,ShortPeriod+LongPeriod,i)];
        else S[i]=S[i+1];
   for(i=0; i<limit; i++)
      MS[i]=(R[i]+S[i])/2;
/**/
   return(0);
  }
//+------------------------------------------------------------------+
Sample
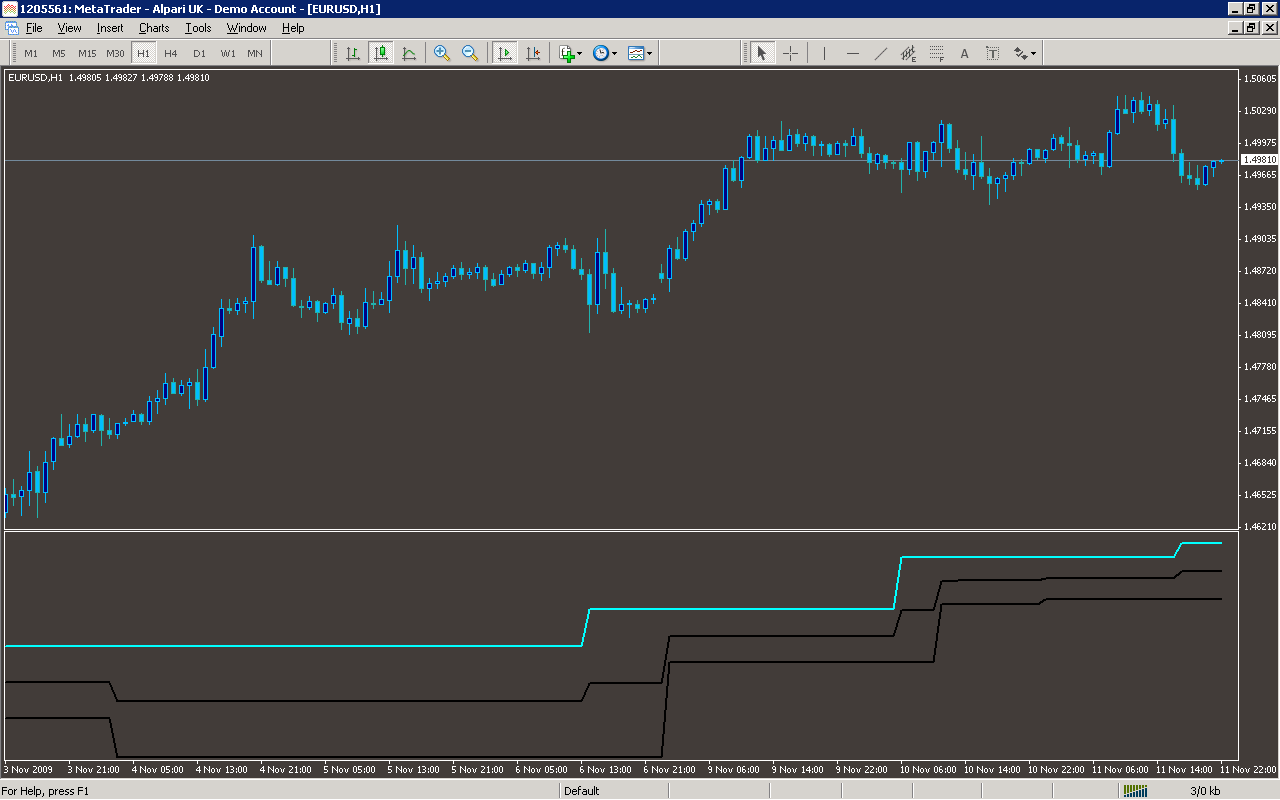
Analysis
Market Information Used:
Series array that contains the highest prices of each bar
Series array that contains the lowest prices of each bar
Series array that contains close prices for each bar
Indicator Curves created:
Implements a curve of type DRAW_LINE
Indicators Used:
Moving average indicator
Custom Indicators Used:
Order Management characteristics:
Other Features: