//+------------------------------------------------------------------+
//|                                         EMA-Crossover_Signal.mq4 |
//|         Copyright © 2005, Jason Robinson (jnrtrading)            |
//|                   http://www.jnrtading.co.uk                     |
//+------------------------------------------------------------------+

/*
  +------------------------------------------------------------------+
  | Allows you to enter two ema periods and it will then show you at |
  | Which point they crossed over. It is more usful on the shorter   |
  | periods that get obscured by the bars / candlesticks and when    |
  | the zoom level is out. Also allows you then to remove the emas   |
  | from the chart. (emas are initially set at 5 and 6)              |
  +------------------------------------------------------------------+
*/
#property copyright "Copyright © 2005, Jason Robinson (jnrtrading)"
#property link      "http://www.jnrtrading.co.uk"

#property indicator_chart_window
#property indicator_buffers 2
#property indicator_color1 SeaGreen
#property indicator_color2 Red

double CrossUp[];
double CrossDown[];
extern int FasterEMA = 4;
extern int SlowerEMA = 8;
extern bool SoundON=true;
double alertTag;
 double control=2147483647;

//+------------------------------------------------------------------+
//| Custom indicator initialization function                         |
//+------------------------------------------------------------------+
int init()
  {
//---- indicators
   SetIndexStyle(0, DRAW_ARROW, EMPTY,3);
   SetIndexArrow(0, 233);
   SetIndexBuffer(0, CrossUp);
   SetIndexStyle(1, DRAW_ARROW, EMPTY,3);
   SetIndexArrow(1, 234);
   SetIndexBuffer(1, CrossDown);
//----
   return(0);
  }
//+------------------------------------------------------------------+
//| Custom indicator deinitialization function                       |
//+------------------------------------------------------------------+
int deinit()
  {
//----

//----
   return(0);
  }
//+------------------------------------------------------------------+
//| Custom indicator iteration function                              |
//+------------------------------------------------------------------+
int start() {
   int limit, i, counter;
   double fasterEMAnow, slowerEMAnow, fasterEMAprevious, slowerEMAprevious, fasterEMAafter, slowerEMAafter;
   double Range, AvgRange;
   int counted_bars=IndicatorCounted();
//---- check for possible errors
   if(counted_bars<0) return(-1);
//---- last counted bar will be recounted
   if(counted_bars>0) counted_bars--;

   limit=Bars-counted_bars;

   for(i = 0; i <= limit; i++) {

      counter=i;
      Range=0;
      AvgRange=0;
      for (counter=i ;counter<=i+9;counter++)
      {
         AvgRange=AvgRange+MathAbs(High[counter]-Low[counter]);
      }
      Range=AvgRange/10;

      fasterEMAnow = iMA(NULL, 0, FasterEMA, 0, MODE_EMA, PRICE_CLOSE, i);
      fasterEMAprevious = iMA(NULL, 0, FasterEMA, 0, MODE_EMA, PRICE_CLOSE, i+1);
      fasterEMAafter = iMA(NULL, 0, FasterEMA, 0, MODE_EMA, PRICE_CLOSE, i-1);

      slowerEMAnow = iMA(NULL, 0, SlowerEMA, 0, MODE_EMA, PRICE_CLOSE, i);
      slowerEMAprevious = iMA(NULL, 0, SlowerEMA, 0, MODE_EMA, PRICE_CLOSE, i+1);
      slowerEMAafter = iMA(NULL, 0, SlowerEMA, 0, MODE_EMA, PRICE_CLOSE, i-1);

      if ((fasterEMAnow > slowerEMAnow) && (fasterEMAprevious < slowerEMAprevious) && (fasterEMAafter > slowerEMAafter)) {
         CrossUp[i] = Low[i] - Range*0.5;
      }
      else if ((fasterEMAnow < slowerEMAnow) && (fasterEMAprevious > slowerEMAprevious) && (fasterEMAafter < slowerEMAafter)) {
          CrossDown[i] = High[i] + Range*0.5;
      }
        if (SoundON==true && i==1 && CrossUp[i] > CrossDown[i] && alertTag!=Time[0]){
         Alert("EMA Cross Trend going Down on ",Symbol()," ",Period());
        alertTag = Time[0];
      }
        if (SoundON==true && i==1 && CrossUp[i] < CrossDown[i] && alertTag!=Time[0]){
       Alert("EMA Cross Trend going Up on ",Symbol()," ",Period());
        alertTag = Time[0];
        }
  }
   return(0);
}
Sample
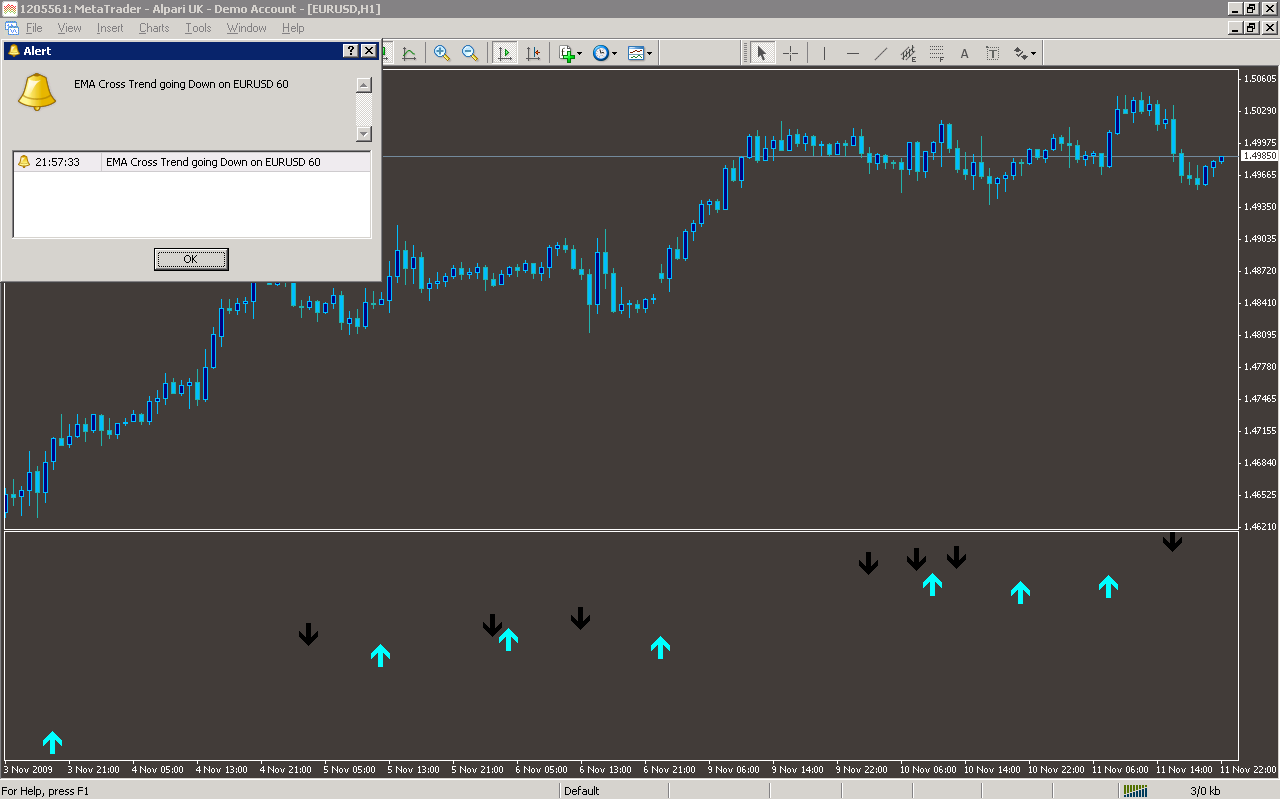
Analysis
Market Information Used:
Series array that contains the highest prices of each bar
Series array that contains the lowest prices of each bar
Series array that contains open time of each bar
Indicator Curves created:
Implements a curve of type DRAW_ARROW
Indicators Used:
Moving average indicator
Custom Indicators Used:
Order Management characteristics:
Other Features:
It issuies visual alerts to the screen