//+------------------------------------------------------------------+
//|                                               EMAPredictive3.mq4 |
//|                                      Matthew ("Dr Chaos") Kennel |
//|                            ftp://lyapunov.ucsd.edu/pub/nonlinear |
//+------------------------------------------------------------------+
/*
 Goal of this indicator:

    Given three EMA's of varying lengths, use their values
    for a estimator of "where we are now" or will be in the near future.
    This is a very simplistic method, better ones are probably found
    in the signal processing and target tracking literature.
    A Kalman filter has been known since the 1950's 1960's and there
    is better still.   Nevertheless this is easily programmable in the
    typical environments of a retail trading application like Metatrader4.

 Method:

     An an exponential moving average (EMA) or a simple moving average (SMA), for that
     matter, have a bandwidth parameter 'L', the effective length of the window.  This
     is in units of time or, really, inverse of frequency.  Higher L means a lower
     frequency effect.
     With a parameter L, the weighted time index of the EMA and SMA is (L-1)/2.  Example:
     take an SMA of the previous 5 values:  -5 -4 -3 -2 -1 now.   The average "amount of time"
     back in the past of the data which go in to the SMA is hence -3, or (L-1)/2.  Same applies
     for an EMA.  The standard parameterization makes this correspondence between EMA
     and SMA.
     Therefore the idea here is to take two different EMA's, a longer, and
     a shorter of lengths L1 and L2  (L2 <L1).     Now take the pairs:
           [ -(L1-1)/2, EMA(L1) ]  [ -(L2-1)/2, EMA(L2) ]  which defines a line.
     Extrapolate to [ExtraTimeForward, y], solve for y and that is the predictive EMA estimate.

 Application:

     Traditional moving averages, as simple-minded linear filters, have significant group delay.
     In engineering that isn't so important as nobody cares if your sound from your iPod is delayed
     a few milliseconds after it is first processed.  But in markets, you can't
     trade on the smoothed price, only the actual noisy, market price now.   Hence you
     ought to estimate better.
     This statistic (what math/science people call what technical analysts call an 'indicator')
     may be useful as the "fast" moving average in a moving average crossover trading system.
     It could also be useful for the slow moving average as well.
     For instance, on a 5 minute chart:
     try for the fast: (will be very wiggly, note)

                           LongPeriod 25.0
                           ShortPeriod 8.0
                           ExtraTimeForward 1.0

       and for the slow:

                           LongPeriod 500.0
                           ShortPeriod 50.0 to 200.0
                           ExtraTimeForward 0.0

  But often a regular MA for the slow can work as well or better, it appears from visual inspection.
  Enjoy.
  In chaos there is order, and in that order there is chaos and order inside again.
  Then, surrounding everything, pointy haired bosses.
*/

#property copyright "Matthew (Dr Chaos) Kennel"
#property link      "ftp://lyapunov.ucsd.edu/pub/nonlinear" // my academic software site.  No finance.
//----
#property indicator_chart_window
#property indicator_buffers 1
#property indicator_color1 Red
//---- input parameters
extern double       LongPeriod=25.0;  // note that for an EMA you can have floating point numbers.
extern double       ShortPeriod=8.0;
extern double       ExtraTimeForward=1.0; // how much to further extrapolate location.
//---- buffers
//---- indicator buffers
double ExtBuffer[];
//+------------------------------------------------------------------+
//| Custom indicator initialization function                         |
//+------------------------------------------------------------------+
int init()
  {
   SetIndexBuffer(0,ExtBuffer);
//---- drawing settings
   SetIndexStyle(0,DRAW_LINE);
//---- initialization done
   return(0);
  }
//+------------------------------------------------------------------+
//|                                                                  |
//+------------------------------------------------------------------+
int start()
  {
   int limit;
   int counted_bars=IndicatorCounted();
   double ma1,ma3;
   double p1,p3;
   double t1,t3,t;
//---- check for possible errors
   if(counted_bars<0) return(-1);
//---- last counted bar will be recounted
   if(counted_bars>0) counted_bars--;
//----
   limit=Bars-counted_bars;
//----
//---- main loop
   p1=2.0/(LongPeriod+1.0);
   p3=2.0/(ShortPeriod+1.0);
   t1=(LongPeriod-1.0)/2.0;
   t3=(ShortPeriod-1.0)/2.0;
   t=ShortPeriod + ExtraTimeForward;
//----
   ma1=Close[limit-1];
   ma3=ma1;
     for(int i=limit-1; i>= 0; i--)
     {
      //---- ma_shift set to 0 because SetIndexShift called abowe
      double val=Close[i];
      double slope1, predict;
//----
      ma1=p1*val + (1.0-p1)*ma1;
      ma3=p3*val + (1.0-p3)*ma3;
      slope1=(ma3-ma1)/(t1-t3);
      predict=ma3 + slope1*t;
      ExtBuffer[i]=predict;
     }
//---- done
   return(0);
  }
//+------------------------------------------------------------------+
Sample
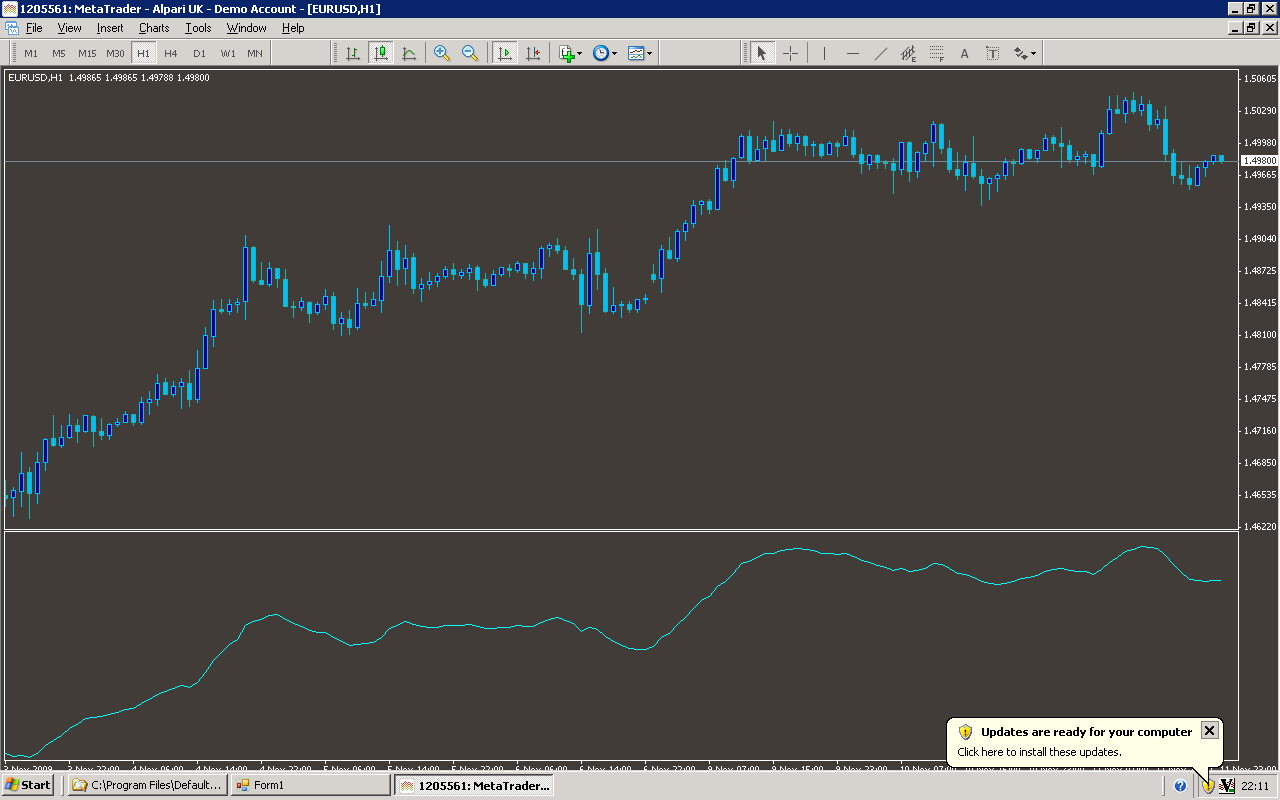
Analysis
Market Information Used:
Series array that contains close prices for each bar
Indicator Curves created:
Implements a curve of type DRAW_LINE
Indicators Used:
Custom Indicators Used:
Order Management characteristics:
Other Features: