//+------------------------------------------------------------------+
//|                                                                  |
//|                 Copyright © 2000-2007, MetaQuotes Software Corp. |
//|                                         http://www.metaquotes.ru |
//+------------------------------------------------------------------+
#property  copyright "Copyright © 2005, Matt Kennel"
#property  link      "Yura.prokofiev@gmail.com"
// Inspired by an idea from Yura.prokofiev@gmail.com
// Idea:  Look back a certain amount of time and find its
// High and Low, normalize current value relative to that
// to make [-1..1].  Filter with Hull-type MA.   Then perform
// Fisher Z-transform on result (making Gaussian).  Plot
// historgram.
#property  indicator_separate_window
#property  indicator_buffers 3
#property  indicator_color1  Black
#property  indicator_color2  Lime
#property  indicator_color3  Red
//----
extern int period=10;
extern double HMALenHiLo=5.0;
extern double HMALenZ=3.0;
//----
double         ExtBuffer0[];
double         ExtBuffer1[];
double         ExtBuffer2[];
//+------------------------------------------------------------------+
//|                                                                  |
//+------------------------------------------------------------------+
int init()
  {
   SetIndexStyle(0,DRAW_NONE);
   SetIndexStyle(1,DRAW_HISTOGRAM);
   SetIndexStyle(2,DRAW_HISTOGRAM);
   IndicatorDigits(Digits+1);
   //
   SetIndexBuffer(0,ExtBuffer0);
   SetIndexBuffer(1,ExtBuffer1);
   SetIndexBuffer(2,ExtBuffer2);
   //
   IndicatorShortName("Fisher_mbk");
   SetIndexLabel(1,NULL);
   SetIndexLabel(2,NULL);
//----
   return(0);
  }
//+------------------------------------------------------------------+
//|                                                                  |
//+------------------------------------------------------------------+
int start()
  {
   int    limit;
   int    counted_bars=IndicatorCounted();
   double prev,current,old;
   double Value=0;
   double price;
   double MinL=0;
   double MaxH=0;
//----
   if(counted_bars>0) counted_bars--;
   limit=Bars-period-1; // counted_bars;
   // Idea, do a HMA on boht the
   int N=Bars-period;
   double HiLo[];
   double HMAofHiLo[];
   double Ztransformed[];
   ArrayResize(HiLo,N);
   ArrayResize(HMAofHiLo,N);
   ArrayResize(Ztransformed,N);
//----
   for(int i=N-1; i>=0; i--)
     {
      MaxH=High[Highest(NULL,0,MODE_HIGH,period,i)];
      MinL=Low[Lowest(NULL,0,MODE_LOW,period,i)];
      price=Close[i]; // (High[i]+Low[i])/2;
      HiLo[i]=2.0* (price-MinL)/(MaxH-MinL) - 1.0;
     }
   HMAOnArray(N,HMALenHiLo,HiLo,HMAofHiLo);
     for(i=N-1; i>=0; i--)
     {
      Value=MathMin(MathMax(HMAofHiLo[i],-0.999),0.999);
      Ztransformed[i]= MathLog((1+Value)/(1-Value));
     }
   HMAOnArray(N,HMALenZ,Ztransformed,ExtBuffer0);
//----
   bool up=true;
   for(i=limit-2; i>=0; i--)
     {
      current=ExtBuffer0[i];
      prev=ExtBuffer0[i+1];
      if (((current<0)&&(prev>0))||(current<0)) up= false;
      if (((current>0)&&(prev<0))||(current>0)) up= true;
      if(!up)
        {
         ExtBuffer2[i]=current;
         ExtBuffer1[i]=0.0;
        }
      else
        {
         ExtBuffer1[i]=current;
         ExtBuffer2[i]=0.0;
        }
     }
//----
   return(0);
  }
//+------------------------------------------------------------------+
//|                                                                  |
//+------------------------------------------------------------------+
  void HMAOnArray(int N, double HMALen, double input[], double& output[])
  {
   // Given input[N-1 .. 0] return HMA filtered version in output.
   double ma1, ma2, hma, mix, mixprime;
   ma1=input[N-1];
   ma2=ma1;
   mix=3.0/(2.0 + HMALen);
   mixprime=1.0-mix;
//----
     for(int i=N-2; i>=0; i--)
     {
      ma1=mixprime*ma1 + mix*input[i];
      ma2=mixprime*ma2 + mix*ma1;
      output[i]=1.5*ma1-ma2;
     }
  }
//+------------------------------------------------------------------+
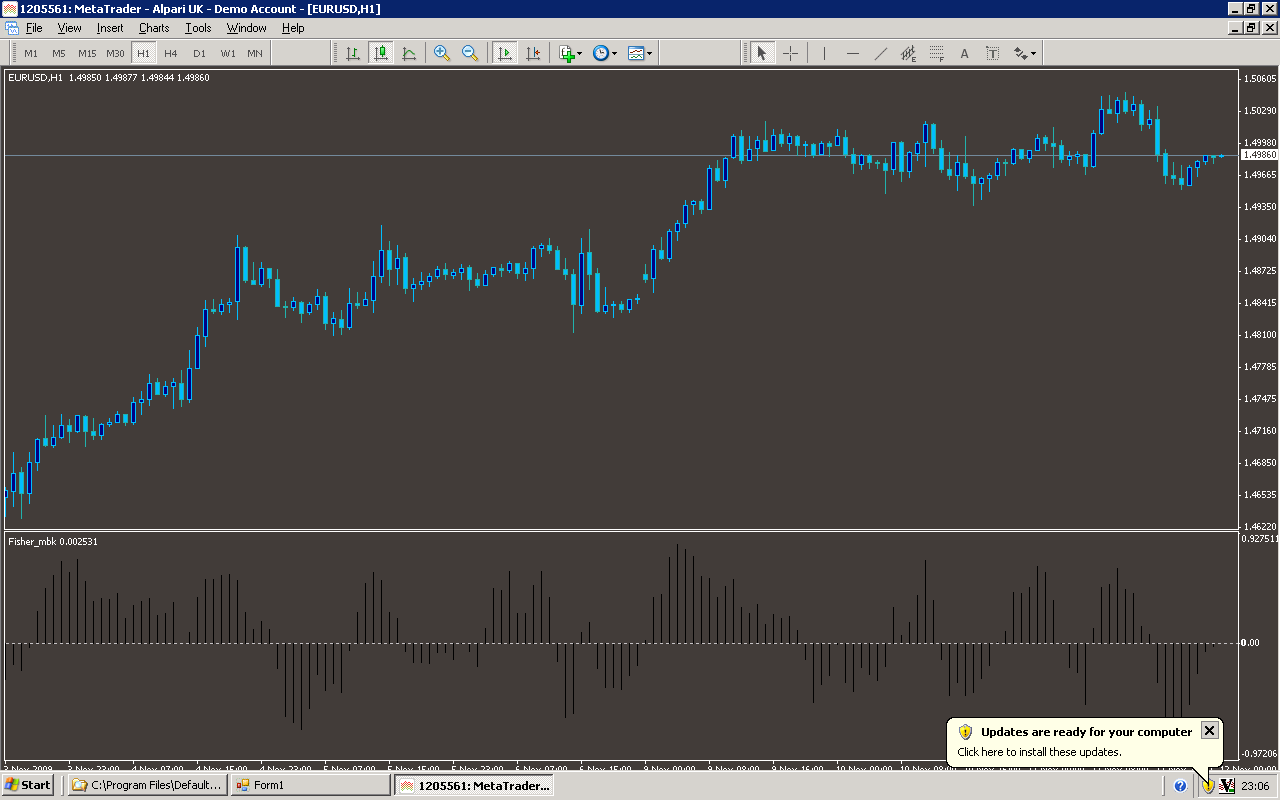
Sample
Analysis
Market Information Used:
Series array that contains the highest prices of each bar
Series array that contains the lowest prices of each bar
Series array that contains close prices for each bar
Indicator Curves created:
Implements a curve of type DRAW_NONE
Implements a curve of type DRAW_HISTOGRAM
Indicators Used:
Custom Indicators Used:
Order Management characteristics:
Other Features: