//+---------------------------------------------------------------------------------+
//|                                                   corelation.mq4                |
//|                                Copyright © 2008, Borys Chekmasov                |
//|                                     http://uatrader.blogspot.com                |
//+---------------------------------------------------------------------------------+
/*
Description:

The indicator is intended for searching the correlations between different symbols. It allows you to overlay
one chart with another to visually detect how different symbols correlate with each other. It also allows
you to superimpose moving averages.
Inputs:

    * simbol_name - the ticker of the symbol whose chart will be layed on the current one;
    * bars_for_autoscale - the amount of bars the charts will be scaled on (0 - maximal amount);
    * inverse - inverses the chart upside down;
    * MA - show or not to the moving average for the overlaid chart (true - show; false - do not show);
    * MAPeriod - the period of the moving average;
    * MAOnly - shows only the moving average (hides chart).

The scaling occurs in the way the maximums and minimums at the region of N-bars (bars_for_autoscale variable) coincide with each other.

The indicator can be used for hedging and spread trade strategies on correlating pairs.
*/

#property copyright "Copyright © 2008, Borys Chekmasov"
#property link      "http://uatrader.blogspot.com"

#property indicator_chart_window
#property indicator_buffers 2
#property indicator_color1 Gold
#property indicator_color2 DodgerBlue
//âõîäíûå ïàðàìåòðû
extern string simbol_name = "EURUSD";
extern int bars_for_autoscale = 200;
extern bool inverse = false;
extern bool MA = false;
extern int MAPeriod =14;
extern bool MAOnly = false;

double simbolBuffer[];
double MABuffer[];

// èíèöèàëèçàöèÿ
int init()
  {
   SetIndexBuffer(0,simbolBuffer);
   SetIndexStyle (0,DRAW_LINE);
      SetIndexBuffer(1,MABuffer);
   SetIndexStyle (1,DRAW_LINE);
   return (0);
  }

//îñíîâíîé öèêë

int start()
  {
double simbol_scale = 1;
double simbol_offset = 0;
 int i,k;
int cb=IndicatorCounted();
i = Bars-cb-1;
k = bars_for_autoscale;
if (bars_for_autoscale==0) k=Bars;
double max_scale=iClose(simbol_name,0,1);
double min_scale=iClose(simbol_name,0,1);
double max_scale2=Close[1];
double min_scale2=Close[1];
while(k>=0)
      {

      if (max_scale<iClose(simbol_name,0,k)) max_scale=iClose(simbol_name,0,k);
      if (min_scale>iClose(simbol_name,0,k)) min_scale=iClose(simbol_name,0,k);
      if (max_scale2<Close[k])max_scale2=Close[k];
      if (min_scale2>Close[k])min_scale2=Close[k];


      k--;
      }

simbol_scale = (max_scale2 - min_scale2)/(max_scale-min_scale);
      if(!inverse) {
 simbol_offset = max_scale2 - simbol_scale*max_scale;
 }
 else
 {
 simbol_offset = max_scale2 + simbol_scale*min_scale;
 }

while(i>=0)
      {

        if(!inverse)
        {
         if (!MAOnly) simbolBuffer[i]=simbol_scale*(iClose(simbol_name,0,i))+simbol_offset;
         if (MA)MABuffer[i]=(iMA(simbol_name,0,MAPeriod,0,0,PRICE_CLOSE,i))*simbol_scale+simbol_offset;
         }
        else
        {
        if (!MAOnly) simbolBuffer[i]=simbol_offset - simbol_scale*(iClose(simbol_name,0,i));
        if (MA)MABuffer[i]=simbol_offset - simbol_scale*(iMA(simbol_name,0,MAPeriod,0,0,PRICE_CLOSE,i));
        }
          i--;
      }


   return(0);
  }
Sample
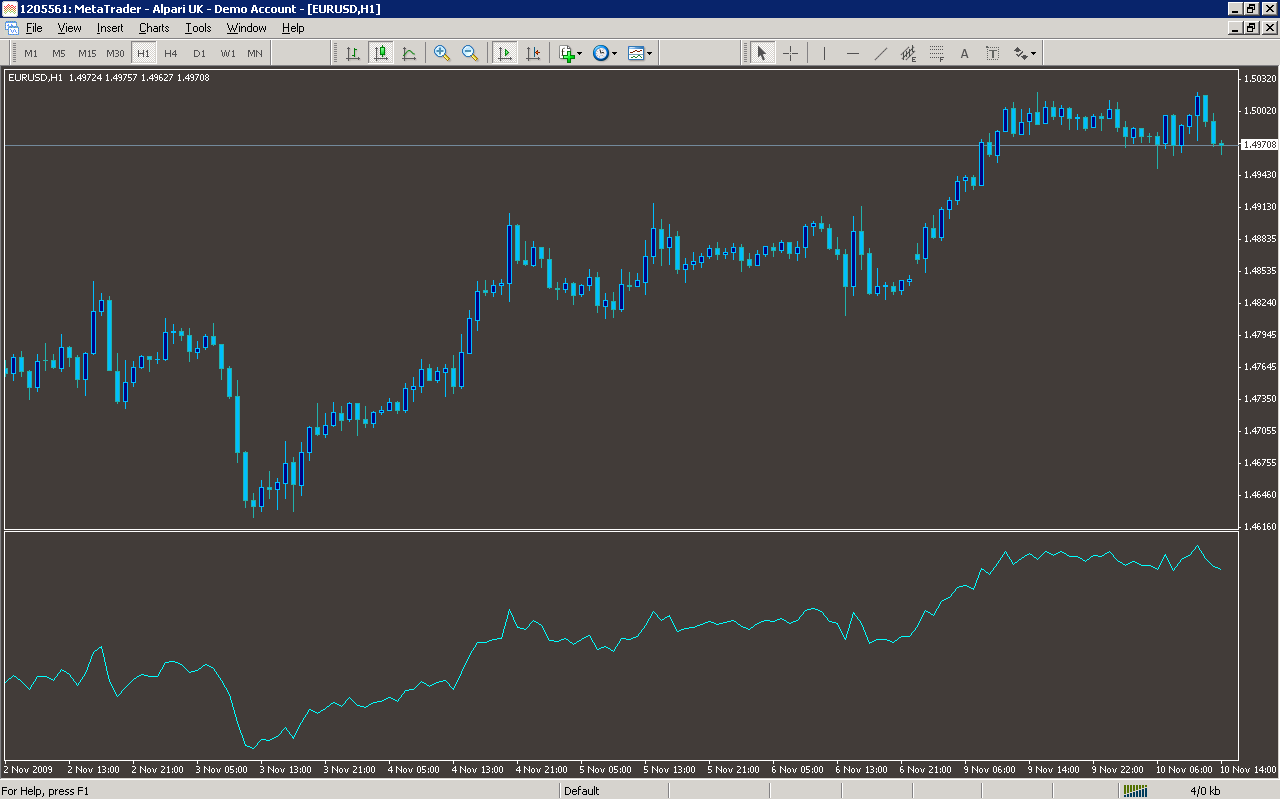
Analysis
Market Information Used:
Series array that contains close prices for each bar
Indicator Curves created:
Indicators Used:
Moving average indicator
Custom Indicators Used:
Order Management characteristics:
Other Features: