//+------------------------------------------------------------------+
//| THANKS to Keris2112 for the #MTF-TEMPLATE code
//| BB-Squeeze converted to MTF format by FX Sniper
//+------------------------------------------------------------------+

#property indicator_chart_window
#property indicator_buffers 3
#property indicator_color1 Aqua
#property indicator_color2 Yellow
#property indicator_color3 Red
#property indicator_width1 2
#property indicator_width2 3
#property indicator_width3 3

/*---- input parameters
PERIOD_M1   1
PERIOD_M5   5
PERIOD_M15  15
PERIOD_M30  30
PERIOD_H1   60
PERIOD_H4   240
PERIOD_D1   1440
PERIOD_W1   10080
PERIOD_MN1  43200
You must use the numeric value of the timeframe that you want to use
when you set the TimeFrame' value with the indicator inputs.
--------------------------------------------------------------------*/
extern int    TimeFrame = 0;
extern int ExtDepth=100;
extern int ExtDeviation=75;
extern int ExtBackstep=15;
//---- indicator buffers
double ExtMapBuffer[];
double ExtMapBuffer2[];

//NonLag
extern int     Price          =    0;  //Apply to Price(0-Close;1-Open;2-High;3-Low;4-Median price;5-Typical price;6-Weighted Close)
extern int     Length         =   29;  //Period of NonLagMA was 14
extern double  PctFilter      =    2;  //Dynamic filter in decimals was 2

double ZZBuffer[];
double MABuffer[];
double trend[];
double Del[];
double AvgDel[];
double alertBar;
double prev;
extern bool sounds=true;
extern bool SoundAlert = true;

int    ilow, ihigh, nlow, nhigh, prevnhigh,prevnlow, BarsBack;
double alfa[];
datetime lotime,hitime;
int    i, Phase, Len, Cycle=4, Back=0;
double Coeff, beta, t, Sum, Weight, g;
double pi = 3.1415926535;

//+------------------------------------------------------------------+
//| Custom indicator initialization function                         |
//+------------------------------------------------------------------+
int init()
  {
//---- indicator line
   //Nonlag
      IndicatorBuffers(7);
   string short_name;
   SetIndexStyle(0,DRAW_SECTION);
   SetIndexBuffer(0,ZZBuffer);
   SetIndexBuffer(1,MABuffer);
   SetIndexBuffer(2,trend);
   SetIndexBuffer(3,Del);
   SetIndexBuffer(4,AvgDel);

   SetIndexStyle(1,DRAW_ARROW);
   SetIndexArrow(1, 233);
   SetIndexStyle(2,DRAW_ARROW);
   SetIndexArrow(2, 234);
//---- indicator buffers mapping
   SetIndexBuffer(1,ExtMapBuffer);
   SetIndexBuffer(2,ExtMapBuffer2);
   SetIndexEmptyValue(0,0.0);

//---- indicator line

   IndicatorDigits(MarketInfo(Symbol(),MODE_DIGITS));
//---- name for DataWindow and indicator subwindow label
   short_name="NonLagZigZag("+Length+")";
   IndicatorShortName(short_name);
   SetIndexLabel(0,"NonLagZigZag");
//----
   SetIndexEmptyValue(0,0.0);
   SetIndexDrawBegin(0,Length*Cycle+Length);
//----

   Coeff =  3*pi;
   Phase = Length-1;
   Len = Length*Cycle + Phase;
   ArrayResize(alfa,Len);
   Weight=0;

      for (i=0;i<Len-1;i++)
      {
      if (i<=Phase-1) t = 1.0*i/(Phase-1);
      else t = 1.0 + (i-Phase+1)*(2.0*Cycle-1.0)/(Cycle*Length-1.0);
      beta = MathCos(pi*t);
      g = 1.0/(Coeff*t+1);
      if (t <= 0.5 ) g = 1;
      alfa[i] = g * beta;
      Weight += alfa[i];
      }
   switch(TimeFrame)
   {
      case 1 : string TimeFrameStr="Period_M1"; break;
      case 5 :        TimeFrameStr="Period_M5"; break;
      case 15 :       TimeFrameStr="Period_M15"; break;
      case 30 :       TimeFrameStr="Period_M30"; break;
      case 60 :       TimeFrameStr="Period_H1"; break;
      case 240 :      TimeFrameStr="Period_H4"; break;
      case 1440 :     TimeFrameStr="Period_D1"; break;
      case 10080 :    TimeFrameStr="Period_W1"; break;
      case 43200 :    TimeFrameStr="Period_MN1"; break;
      default :       TimeFrameStr="Current Timeframe";
   }
   IndicatorShortName("MTF NonLagZigZag: ("+TimeFrameStr+")");
  }
//----
   return(0);

//+------------------------------------------------------------------+
//|                                                                  |
//+------------------------------------------------------------------+
int start()
{
   datetime TimeArray[];
   int    i,limit,y=0,counted_bars=IndicatorCounted();

// Plot defined time frame on to current time frame

   ArrayCopySeries(TimeArray,MODE_TIME,Symbol(),TimeFrame);

   limit= Bars-1;
   for(i=0,y=0;i<limit;i++)
   {
   if (Time[i]<TimeArray[y]) y++;

/***********************************************************
   Add your main indicator loop below.  You can reference an existing
      indicator with its iName  or iCustom.
   Rule 1:  Add extern inputs above for all neccesary values
   Rule 2:  Use 'TimeFrame' for the indicator time frame
   Rule 3:  Use 'y' for your indicator's shift value
 **********************************************************/

      ZZBuffer[i]=iCustom(Symbol(),TimeFrame,"NonLagZigZag_v2",0,y);
      ExtMapBuffer[i]=iCustom(Symbol(),TimeFrame,"ZigZag Pointer",0,y);
      ExtMapBuffer2[i]=iCustom(Symbol(),TimeFrame,"ZigZag Pointer",1,y);
      if(prev == 0) prev = ExtMapBuffer[i];
      if(Time[i]==TimeArray[y] && ExtMapBuffer[i] != 0 && prev > ZZBuffer[i] && ExtMapBuffer[i] == ExtMapBuffer2[i] && SoundAlert == true && Bars>alertBar) {Alert("#MTF MTF NonLagZiZag going Up "," ex= ",ExtMapBuffer[i]," ex2= ",ExtMapBuffer2[i]," zz= ",ZZBuffer[i]," prev= ",prev + " on the " +  Period() + " minute chart.");alertBar = Bars;prev = ExtMapBuffer[i];}
      if(Time[i]==TimeArray[y] && ExtMapBuffer[i] != 0 && prev < ZZBuffer[i] && ExtMapBuffer[i] == ExtMapBuffer2[i] && SoundAlert == true && Bars>alertBar) {Alert("#MTF MTF NonLagZiZag going Down "," ex= ",ExtMapBuffer[i]," ex2= ",ExtMapBuffer2[i]," zz= ",ZZBuffer[i]," prev= ",prev + " on the " + Period() + " minute chart.");alertBar = Bars;prev = ExtMapBuffer[i];}
   }
   return(0);
  }
//+------------------------------------------------------------------+
Sample
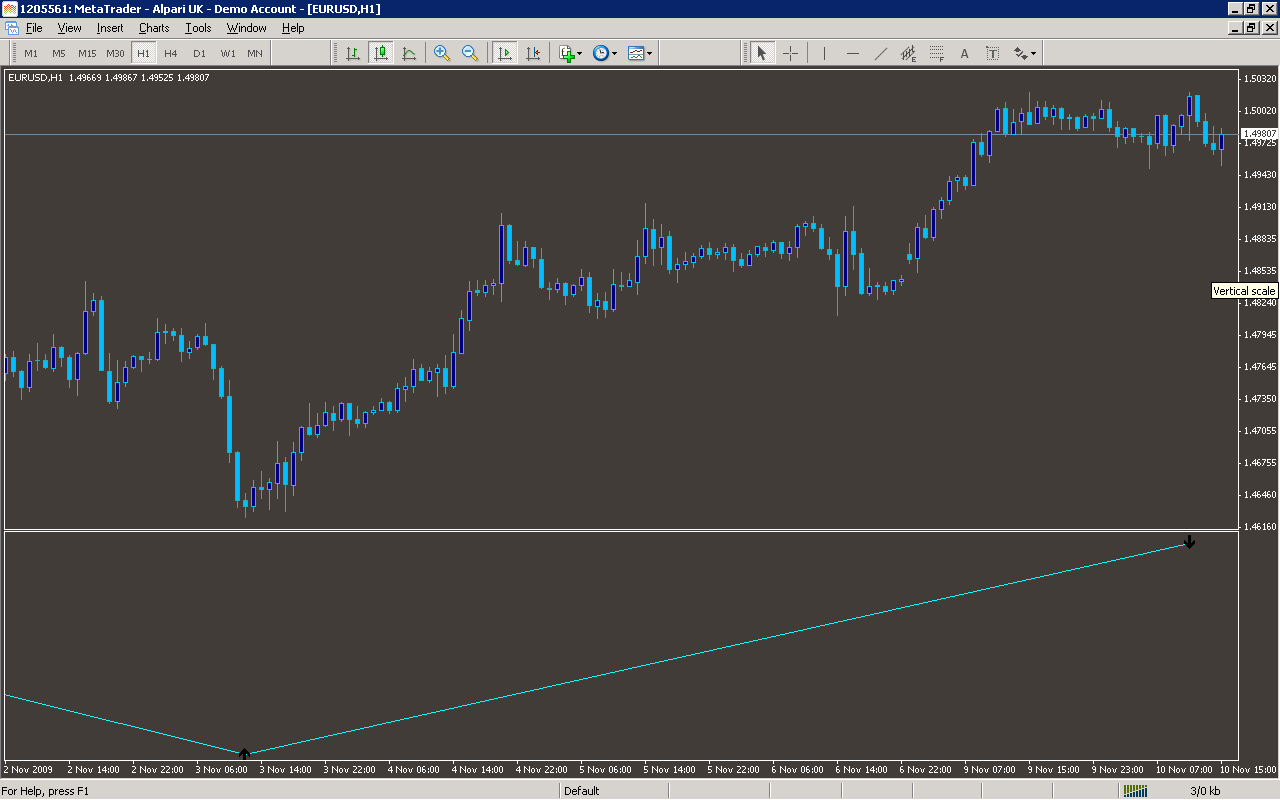
Analysis
Market Information Used:
Series array that contains open time of each bar
Indicator Curves created:
Implements a curve of type DRAW_SECTION
Implements a curve of type DRAW_ARROW
Indicators Used:
Custom Indicators Used:
NonLagZigZag_v2
ZigZag Pointer
Order Management characteristics:
Other Features:
It issuies visual alerts to the screen