//+------------------------------------------------------------------+
//| Grid10.mq4 |
//| Copyright © M00SE 2009 |
//| |
//| G R I D 1 0 |
//| |
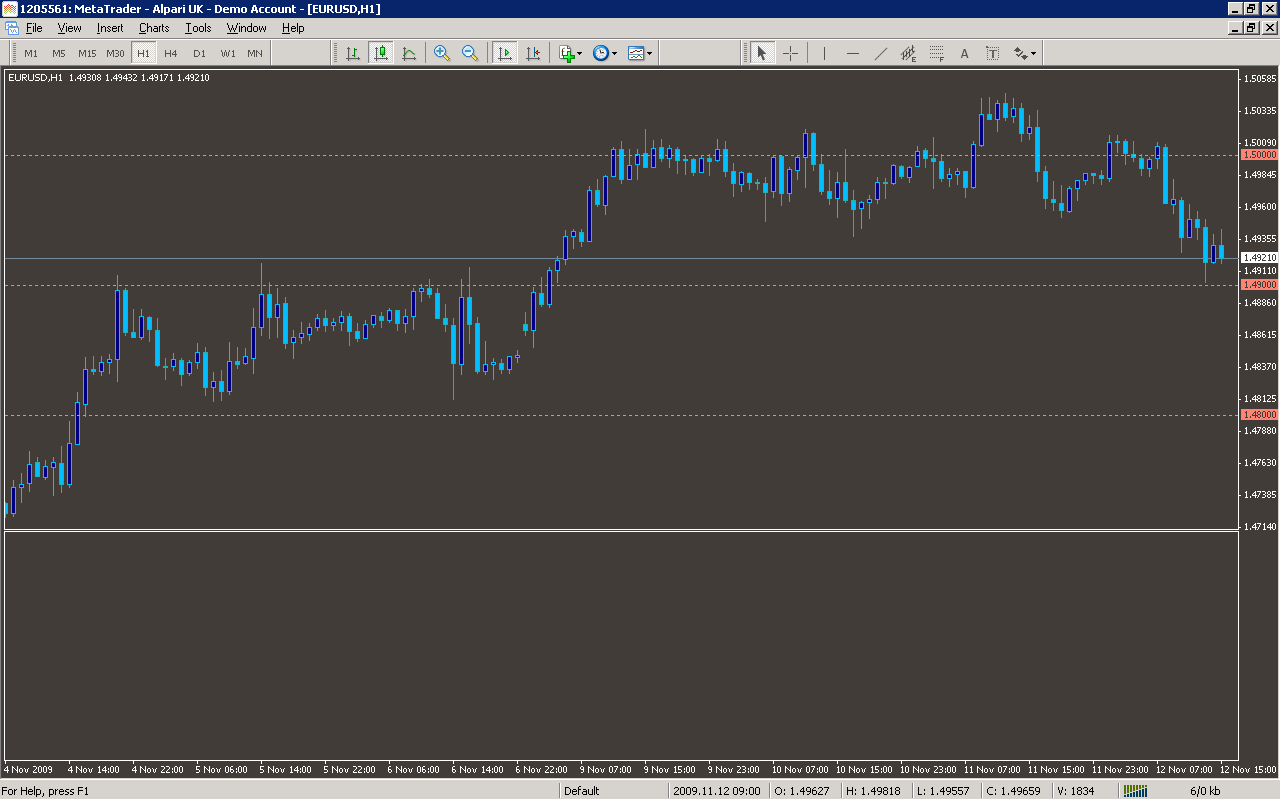
//| This indicator will draw a grid on a chart using grid lines |
//| separated at a convenient power of ten (popular with humans!) |
//| eg. an index chart with range 10,200 to 10,800 will use a |
//| resolution of 100 whereas a currency pair chart with range |
//| 1.56100 to 1.56900 will use a resolution of 0.01 |
//+------------------------------------------------------------------+
#property copyright "Copyright © M00SE 2009"
#property indicator_chart_window
//---- input parameters
//---- data
int gridCt;
string sGrid = "GridLine";
//+------------------------------------------------------------------+
//| expert initialization function |
//+------------------------------------------------------------------+
int init()
{
//----
//----
return(0);
}
//+------------------------------------------------------------------+
//| expert deinitialization function |
//+------------------------------------------------------------------+
int deinit()
{
//----
string sGridLine;
for(int gridNo=0; gridNo < gridCt; gridNo++)
{
sGridLine = sGrid + CharToStr('0' + gridNo);
ObjectDelete(sGridLine);
}
//----
return(0);
}
//+------------------------------------------------------------------+
//| expert start function |
//+------------------------------------------------------------------+
int start()
{
double hiBarHi, loBarLo;
int hiBar, loBar;
string sGridLine;
double gridRes = 0.0100;
double gridPos, startPos;
double range;
static double prevRange;
int numBars, firstBar;
static int prevNumBars;
// calculate the number of bars displayed on the chart
numBars = WindowBarsPerChart();
firstBar = WindowFirstVisibleBar() - numBars;
if(firstBar < 0)
{
firstBar = 0;
}
if(firstBar + numBars > WindowFirstVisibleBar())
{
numBars = WindowFirstVisibleBar() - firstBar;
}
// calculate the high - low range of the chart
hiBar = iHighest(NULL, 0, MODE_HIGH, numBars, firstBar);
hiBarHi = High[hiBar];
loBar = iLowest(NULL, 0, MODE_LOW, numBars, firstBar);
loBarLo = Low[loBar];
range = hiBarHi - loBarLo;
// need only draw the grid if the high - low range has changed
// or the number of bars displayed has changed (ie. the chart has been resized)
if((prevRange != range) || (prevNumBars != numBars))
{
deinit();
prevRange = range;
prevNumBars = numBars;
// select a grid resolution based on the range of the chart
if(range > 10000.0)
gridRes = 10000.0;
else if (range > 1000.0)
gridRes = 1000.0;
else if(range > 100.0)
gridRes = 100.0;
else if(range > 10.0)
gridRes = 10.0;
else if(range > 1.0)
gridRes = 1.0;
else if (range > 0.1000)
gridRes = 0.1000;
else
gridRes = 0.0100;
// draw the grid lines to encompass the full range of the chart
startPos = loBarLo - gridRes;
gridPos = startPos - MathMod(startPos, gridRes);
gridCt = 0;
while(gridPos < hiBarHi + gridRes)
{
sGridLine = sGrid + CharToStr('0' + gridCt);
ObjectCreate(sGridLine, OBJ_HLINE, 0, 0, gridPos);
ObjectSet(sGridLine, OBJPROP_COLOR, Salmon);
ObjectSet(sGridLine, OBJPROP_STYLE, STYLE_DOT);
gridPos += gridRes;
gridCt++;
}
//---- force objects drawing
ObjectsRedraw();
}
return(0);
}
//+------------------------------------------------------------------+
Sample
Analysis
Market Information Used:
Series array that contains the highest prices of each bar
Series array that contains the lowest prices of each bar
Indicator Curves created:
Indicators Used:
Custom Indicators Used:
Order Management characteristics:
Other Features: