//+------------------------------------------------------------------+
//|                                       #MTF Pivot.mq4 |
//|                      Copyright © 2005, MetaQuotes Software Corp. |
//|                                        http://www.metaquotes.net |
//+------------------------------------------------------------------+
#property copyright "Copyright © 2005, MetaQuotes Software Corp."
#property link      "http://www.metaquotes.net"


#property indicator_chart_window
#property indicator_buffers 7
#property indicator_color1 Orange
#property indicator_color2 Blue
#property indicator_color3 Red
#property indicator_color4 Blue
#property indicator_color5 Red
#property indicator_color6 LightGreen
#property indicator_color7 LightGreen

//---- input parameters
/*************************************************************************
PERIOD_M1   1
PERIOD_M5   5
PERIOD_M15  15
PERIOD_M30  30
PERIOD_H1   60
PERIOD_H4   240
PERIOD_D1   1440
PERIOD_W1   10080
PERIOD_MN1  43200
You must use the numeric value of the timeframe that you want to use
when you set the TimeFrame' value with the indicator inputs.
**************************************************************************/
extern int TimeFrame=1440;
extern double  Per=0;


double ExtMapBuffer1[];
double ExtMapBuffer2[];
double ExtMapBuffer3[];
double ExtMapBuffer4[];
double ExtMapBuffer5[];
double ExtMapBuffer6[];
double ExtMapBuffer7[];


//+------------------------------------------------------------------+
//| Custom indicator initialization function                         |
//+------------------------------------------------------------------+
int init()
  {

//---- indicator line
  SetIndexBuffer(0,ExtMapBuffer1);
   SetIndexStyle(0,DRAW_LINE,EMPTY,1);
   SetIndexArrow(0,159);
   SetIndexBuffer(1,ExtMapBuffer2);
   SetIndexStyle(1,DRAW_LINE,EMPTY,1);
   SetIndexArrow(1,159);
   SetIndexBuffer(2,ExtMapBuffer3);
   SetIndexStyle(2,DRAW_LINE,EMPTY,1);
   SetIndexArrow(2,159);
   SetIndexBuffer(3,ExtMapBuffer4);
   SetIndexStyle(3,DRAW_LINE,EMPTY,1);
   SetIndexArrow(3,159);
   SetIndexBuffer(4,ExtMapBuffer5);
   SetIndexStyle(4,DRAW_LINE,EMPTY,1);
   SetIndexArrow(4,159);
   SetIndexBuffer(5,ExtMapBuffer6);
   SetIndexStyle(5,DRAW_LINE,EMPTY,1);
   SetIndexArrow(5,159);
   SetIndexBuffer(6,ExtMapBuffer7);
   SetIndexStyle(6,DRAW_LINE,EMPTY,1);
   SetIndexArrow(6,159);


//---- name for DataWindow and indicator subwindow label
   switch(TimeFrame)
   {
      case 1 : string TimeFrameStr="Period_M1"; break;
      case 5 : TimeFrameStr="Period_M5"; break;
      case 15 : TimeFrameStr="Period_M15"; break;
      case 30 : TimeFrameStr="Period_M30"; break;
      case 60 : TimeFrameStr="Period_H1"; break;
      case 240 : TimeFrameStr="Period_H4"; break;
      case 1440 : TimeFrameStr="Period_D1"; break;
      case 10080 : TimeFrameStr="Period_W1"; break;
      case 43200 : TimeFrameStr="Period_MN1"; break;
      default : TimeFrameStr="Current Timeframe";
   }
   IndicatorShortName("MTF Center of Gravity ("+TimeFrameStr+")");
  }
//----
   return(0);

//+------------------------------------------------------------------+
//| MTF Parabolic Sar                                         |
//+------------------------------------------------------------------+
int start()
  {
   datetime TimeArray[];
   int    i,limit,y=0,counted_bars=IndicatorCounted();

// Plot defined time frame on to current time frame
   ArrayCopySeries(TimeArray,MODE_TIME,Symbol(),TimeFrame);

   limit=Bars-counted_bars;
   for(i=0,y=0;i<limit;i++)
   {
   if (Time[i]<TimeArray[y]) y++;

/***********************************************************
   Add your main indicator loop below.  You can add the full
      indicator code or you can just reference an existing
      indicator with its iValue or iCustom.
   Rule 1:  Add extern inputs above for all neccesary values
   Rule 2:  Use 'TimeFrame' for the indicator time frame
   Rule 3:  Use 'y' for your indicator's shift value
 **********************************************************/

   ExtMapBuffer1[i]=iCustom(NULL,TimeFrame,"Pivot1",Per,0,y);
   ExtMapBuffer2[i]=iCustom(NULL,TimeFrame,"Pivot1",Per,1,y);
    ExtMapBuffer3[i]=iCustom(NULL,TimeFrame,"Pivot1",Per,2,y);
   ExtMapBuffer4[i]=iCustom(NULL,TimeFrame,"Pivot1",Per,3,y);
    ExtMapBuffer5[i]=iCustom(NULL,TimeFrame,"Pivot1",Per,4,y);
   ExtMapBuffer6[i]=iCustom(NULL,TimeFrame,"Pivot1",Per,5,y);
    ExtMapBuffer7[i]=iCustom(NULL,TimeFrame,"Pivot1",Per,6,y);

   }

//


   return(0);
  }
//+------------------------------------------------------------------+
Sample
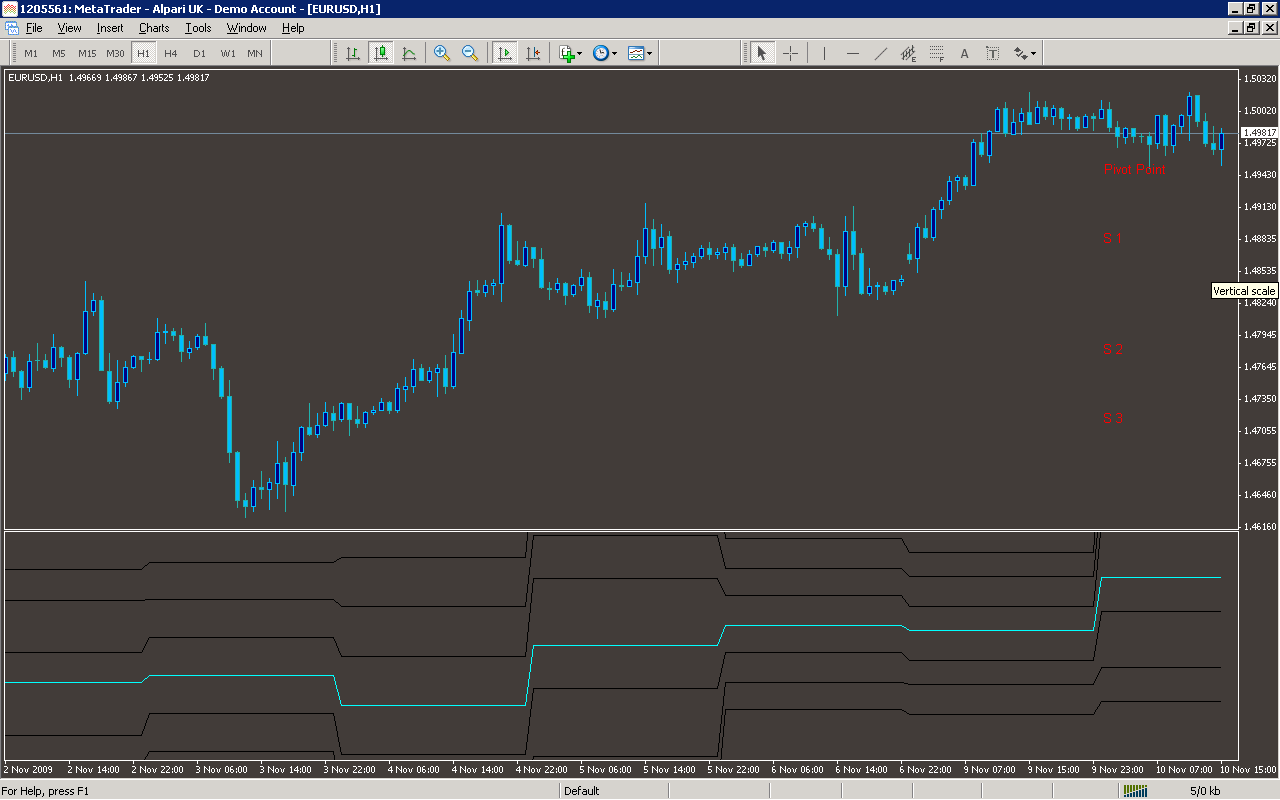
Analysis
Market Information Used:
Series array that contains open time of each bar
Indicator Curves created:
Implements a curve of type DRAW_LINE
Indicators Used:
Custom Indicators Used:
Pivot1
Order Management characteristics:
Other Features: