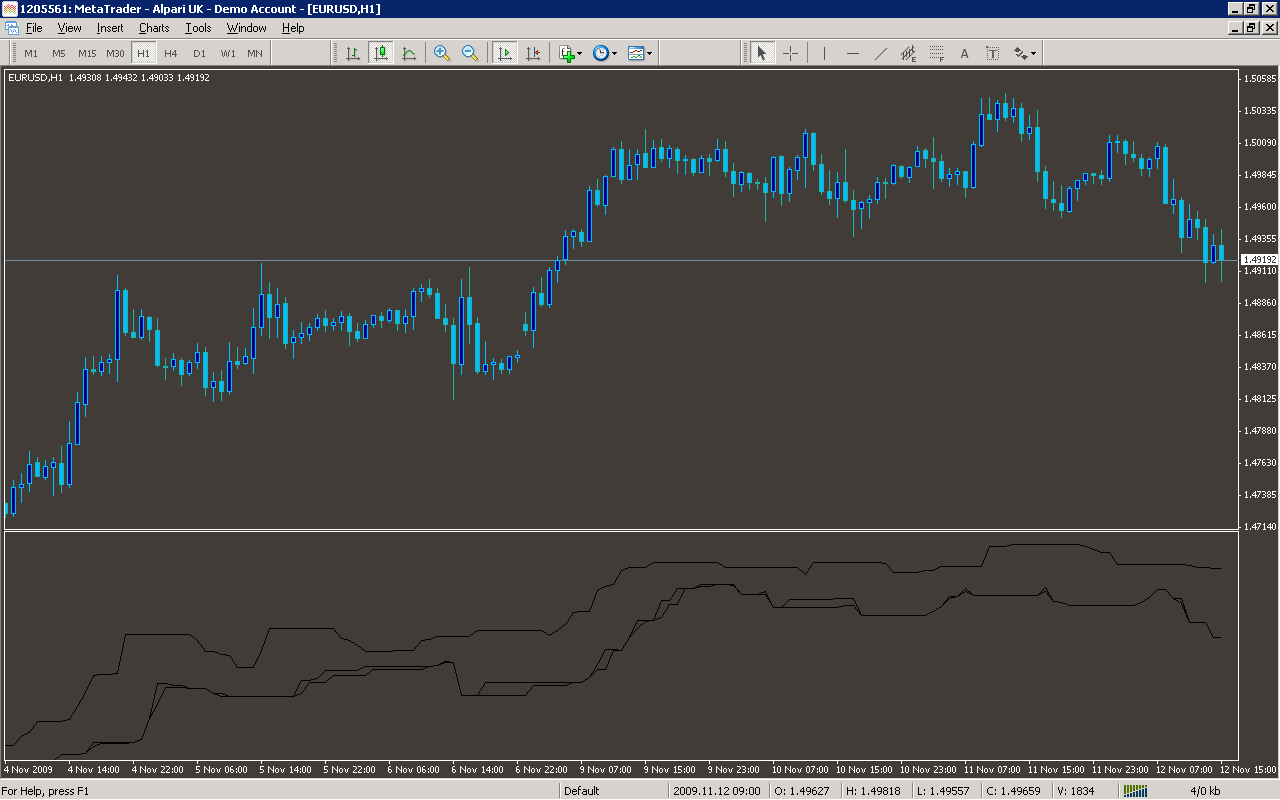
/*-----------------------------+
|			       |
| Shared by www.Aptrafx.com    |
|			       |
+------------------------------*/

//+------------------------------------------------------------------+
//|
//|
//+------------------------------------------------------------------+
#property copyright "HiLoBands"
#property link      ""

#property indicator_chart_window
#property indicator_buffers 5

#property indicator_color1 White
#property indicator_color2 Aqua
#property indicator_color3 Aqua
#property indicator_color4 Orange
#property indicator_color5 Orange

// THIS SHOWS A BUG WITH THE LOWER BANDS ON MY METATRADER


extern int CountBars=4000;

extern int bandlen=9;
int counter=0;
//---- buffers


double highline[],lowline[];
double highline2[],lowline2[];

//+------------------------------------------------------------------+
//| Custom indicator initialization function                         |
//+------------------------------------------------------------------+
int init()
  {
   string short_name;
//---- indicator line
   IndicatorBuffers(4);
   SetIndexStyle(0,DRAW_LINE);
   SetIndexStyle(1,DRAW_LINE);
   SetIndexBuffer(0,highline);
   SetIndexBuffer(1,lowline);
   SetIndexStyle(2,DRAW_LINE);
   SetIndexStyle(3,DRAW_LINE);
   SetIndexBuffer(2,highline2);
   SetIndexBuffer(3,lowline2);
//----
   return(0);
  }


//+------------------------------------------------------------------+
//| SilverTrend_PowerLaw                                             |
//+------------------------------------------------------------------+
int start()
  {
   CountBars = MathMin(Bars-bandlen-1,CountBars);

   int i,shift,counted_bars=IndicatorCounted();
   int i1,i2;
   int limit;
//----

//----
   if (counted_bars<0) return(-1);
   if (counted_bars>0) counted_bars--;


   limit = CountBars; // -counted_bars;
   if (limit < 1) limit = 1;
   ArrayResize(highline,limit);
   ArrayResize(lowline,limit);

   for (shift = limit; shift>=0; shift--)
   {
      double center, highweighted, lowweighted,range;

      // collect running highs and lows back in time.
      // high[k] means the highest high in the previous 'k' timesteps,
      // starting at shift.  Therefore high[k] must be monotonically increasing
      // as low[k] is monotonically decreasing.
      //
      int offset = 1;
      // for offset = 1 start computing using previous bar's data only, this may be
      // needed for causality if using a trading system
      double H1,L1;
      double H2,L2;

      H1 = High[Highest(Symbol(),0,PRICE_HIGH,bandlen,shift+offset)];
      L1 = Low[Lowest(Symbol(),0,PRICE_LOW,bandlen,shift+offset)];
      highline[shift] = H1;
      lowline[shift] = L1;
      // now do it manually
      H2 = High[shift+offset];
      L2 = Low[shift+offset];
      for (int k=1; k < bandlen; k++) {
         double HV = High[shift+k+offset];
         if (HV > H2) H2 = HV;
         //L2 = MathMin(L2,iLow(Symbol(),0,shift+k+offset));
         double LV = Low[shift+k+offset];
         if (LV < L2) L2 = LV;
      }
      highline2[shift] = H2;
      lowline2[shift] = L2;
    }

    //for (shift = limit; shift >= 0; shift--) {
 //     if (shift < CountBars-SmoothingLength-1) {
 //        smoothed[shift] = iMAOnArray(centerline,0,SmoothingLength,ma_shift,MODE_SMA,shift);
//         smoothedhigh[shift] = smoothed[shift] + range/2*WidthPCT/100;
//         smoothedlow[shift] = smoothed[shift]- range/2*WidthPCT/100;
//
//      } else
//         smoothed[shift] = 0.0;
//
//   }
   return(0);
}
//+------------------------------------------------------------------+
Sample
Analysis
Market Information Used:
Series array that contains the highest prices of each bar
Series array that contains the lowest prices of each bar
Indicator Curves created:
Implements a curve of type DRAW_LINE
Indicators Used:
Custom Indicators Used:
Order Management characteristics:
Other Features:
