//+------------------------------------------------------------------+
//|                                        camarilladtHistorical.mq4 |
//|                      Copyright © 2005, MetaQuotes Software Corp. |
//|                                        http://www.metaquotes.net |
//| Modified to chart historical camarilla pivots                    |
//+------------------------------------------------------------------+
#property copyright "Copyright © 2005, MetaQuotes Software Corp."
#property link      "http://www.metaquotes.net"

#property indicator_chart_window
#property indicator_buffers 7
#property indicator_color1 Green
#property indicator_color2 Green
#property indicator_color3 Green
#property indicator_color4 Yellow
#property indicator_color5 Red
#property indicator_color6 Red
#property indicator_color7 Red
#property indicator_width1 2
#property indicator_width2 2
#property indicator_width3 2
#property indicator_width4 1
#property indicator_width5 2
#property indicator_width6 2
#property indicator_width7 2

//---- input parameters

extern int  GMTshift=0;
extern color HColor = Green;
extern color LColor = Red;
extern int fontsize=10;

double H5Buffer[];
double H4Buffer[];
double H3Buffer[];
double PivotBuffer[];
double L3Buffer[];
double L4Buffer[];
double L5Buffer[];

double P, H3, H4, H5;
double L3, L4, L5;

double D1=0.091667;
double D2=0.183333;
double D3=0.2750;
double D4=0.55;

double yesterday_high=0;
double yesterday_low=0;
double yesterday_close=0;
double cur_day=0;
double prev_day=0;
double day_high=0;
double day_low=0;
//string Pivot="CamPivot",SupL3="L3", ResH3="H3";
//string SupL4="L4", ResH4="H4", SupL5="L5", ResH5="H5";

//+------------------------------------------------------------------+
//| Custom indicator initialization function                         |
//+------------------------------------------------------------------+
int init()
  {
   IndicatorBuffers(7);
//---- indicators
   SetIndexStyle(0,DRAW_LINE, 0,2,Green);
   SetIndexBuffer(0,H5Buffer);
   SetIndexStyle(1,DRAW_LINE, 0,2,Green);
   SetIndexBuffer(1,H4Buffer);
   SetIndexStyle(2,DRAW_LINE, 0,2,Green);
   SetIndexBuffer(2,H3Buffer);
   SetIndexStyle(3,DRAW_LINE, STYLE_DASH, 1, Yellow);
   SetIndexBuffer(3,PivotBuffer);
   SetIndexStyle(4,DRAW_LINE, 0,2,Red);
   SetIndexBuffer(4,L3Buffer);
   SetIndexStyle(5,DRAW_LINE, 0,2,Red);
   SetIndexBuffer(5,L4Buffer);
   SetIndexStyle(6,DRAW_LINE, 0,2,Red);
   SetIndexBuffer(6,L5Buffer);

   SetIndexLabel(0,"H5");
   SetIndexLabel(1,"H4");
   SetIndexLabel(2,"H3");
   SetIndexLabel(3,"Pivot");
   SetIndexLabel(4,"L3");
   SetIndexLabel(5,"L4");
   SetIndexLabel(6,"L5");


//----
//   IndicatorShortName("Cam Pivots");
   SetIndexDrawBegin(0,200);
   SetIndexDrawBegin(1,200);
   SetIndexDrawBegin(2,200);
   SetIndexDrawBegin(3,200);
   SetIndexDrawBegin(4,200);
   SetIndexDrawBegin(5,200);
   SetIndexDrawBegin(6,200);

//----
   return(0);
  }
//+------------------------------------------------------------------+
//| Custor indicator deinitialization function                       |
//+------------------------------------------------------------------+
int deinit()
  {
//---- TODO: add your code here
   ObjectDelete("CamPivot");
   ObjectDelete("SupL3");
   ObjectDelete("ResH3");
   ObjectDelete("SupL4");
   ObjectDelete("ResH4");
   ObjectDelete("SupL5");
   ObjectDelete("ResH5");
   Comment("");
//----
   return(0);
  }


//+------------------------------------------------------------------+
//| Custom indicator iteration function                              |
//+------------------------------------------------------------------+
int start()
  {
   int    counted_bars=IndicatorCounted();
   int cnt, limit;

//---- exit if period is greater than 4 hr charts
   if(Period() > 240)
   {
      Alert("Error - Chart period is greater than 4 Hr.");
      return(-1); // then exit
   }
   if(counted_bars<0) return(-1);

//---- last counted bar will be recounted
//   if(counted_bars>0) counted_bars--;

//   limit=(Bars-counted_bars)-1;
   limit=counted_bars;
Comment("Limit = ",limit," Bars = ",Bars);

//---- Get new daily prices & calculate pivots

   for (cnt=limit;cnt >=0;cnt--)
   {
/*      if (High[cnt+1]>day_high) day_high=High[cnt+1];
      if (Low[cnt+1]<day_low) day_low=Low[cnt+1];

      if (TimeDay(Time[cnt])!=TimeDay(Time[cnt+1]))
*/
   	if (DayOfWeek() == 1)
	   {
        cur_day = TimeDay(Time[cnt]- ((GMTshift-3)*3600));
	   }
	   else
	   {
        cur_day = TimeDay(Time[cnt]- (GMTshift*3600));
	   }

   	if (prev_day != cur_day)
   	{
	   	yesterday_close = Close[cnt+1];
		   yesterday_high = day_high;
		   yesterday_low = day_low;

		   if (DayOfWeek() != 0)
		   {
		     day_high = High[cnt];
		     day_low  = Low[cnt];
		   }

		   prev_day = cur_day;
	   }
	   if (DayOfWeek() != 0)
	   {
         if (High[cnt]>day_high)
         {
            day_high = High[cnt];
         }
         if (Low[cnt]<day_low)
         {
            day_low = Low[cnt];
         }
      }

P = (yesterday_high + yesterday_low + yesterday_close)/3;//Pivot
//---- To display all 8 Camarilla pivots remove comment symbols below and
// add the appropriate object functions below
H5 = (yesterday_high/yesterday_low)*yesterday_close;
H4 = ((yesterday_high - yesterday_low)* D4) + yesterday_close;
H3 = ((yesterday_high - yesterday_low)* D3) + yesterday_close;
//H2 = ((yesterday_high - yesterday_low) * D2) + yesterday_close;
//H1 = ((yesterday_high - yesterday_low) * D1) + yesterday_close;

//L1 = yesterday_close - ((yesterday_high - yesterday_low)*(D1));
//L2 = yesterday_close - ((yesterday_high - yesterday_low)*(D2));
L3 = yesterday_close - ((yesterday_high - yesterday_low)*(D3));
L4 = yesterday_close - ((yesterday_high - yesterday_low)*(D4));
L5 = yesterday_close - (H5 - yesterday_close);


//         day_low=Open[cnt]; day_high=Open[cnt];

      if(ObjectFind("CamPivot") != 0)
      {
        ObjectCreate("CamPivot", OBJ_TEXT, 0, 0,0);
        ObjectSetText("CamPivot", "                 Pivot",fontsize,"Arial",Yellow);
      }
      else
      {
        ObjectMove("CamPivot", 0, Time[cnt],P);
      }

      if(ObjectFind("SupL3") != 0)
      {
      ObjectCreate("SupL3", OBJ_TEXT, 0, 0, 0);
      ObjectSetText("SupL3", "      L 3",fontsize,"Arial",LColor);
      }
      else
      {
         ObjectMove("SupL3", 0, Time[cnt],L3);
      }

      if(ObjectFind("ResH3") != 0)
      {
      ObjectCreate("ResH3", OBJ_TEXT, 0, 0, 0);
      ObjectSetText("ResH3", "      H 3",fontsize,"Arial",HColor);
      }
      else
      {
         ObjectMove("ResH3", 0, Time[cnt],H3);
      }

      if(ObjectFind("SupL4") != 0)
      {
      ObjectCreate("SupL4", OBJ_TEXT, 0, 0, 0);
      ObjectSetText("SupL4", "      L 4",fontsize,"Arial",LColor);
      }
      else
      {
         ObjectMove("SupL4", 0, Time[cnt],L4);
      }

      if(ObjectFind("ResH4") != 0)
      {
      ObjectCreate("ResH4", OBJ_TEXT, 0, 0, 0);
      ObjectSetText("ResH4", "      H 4",fontsize,"Arial",HColor);
      }
      else
      {
         ObjectMove("ResH4", 0, Time[cnt],H4);
      }

      if(ObjectFind("SupL5") != 0)
      {
      ObjectCreate("SupL5", OBJ_TEXT, 0, 0, 0);
      ObjectSetText("SupL5", "      L 5",fontsize,"Arial",LColor);
      }
      else
      {
         ObjectMove("SupL5", 0, Time[cnt],L5);
      }

      if(ObjectFind("ResH5") != 0)
      {
      ObjectCreate("ResH5", OBJ_TEXT, 0, 0, 0);
      ObjectSetText("ResH5", "      H 5",fontsize,"Arial",HColor);
      }
      else
      {
         ObjectMove("ResH5", 0, Time[cnt],H5);
      }

//---  Draw  Pivot lines on chart

      PivotBuffer[cnt]=P;
      H5Buffer[cnt]=H5;
      H4Buffer[cnt]=H4;
      H3Buffer[cnt]=H3;
      L3Buffer[cnt]=L3;
      L4Buffer[cnt]=L4;
      L5Buffer[cnt]=L5;

   }

//----
   return(0);
  }
//+------------------------------------------------------------------+
Sample
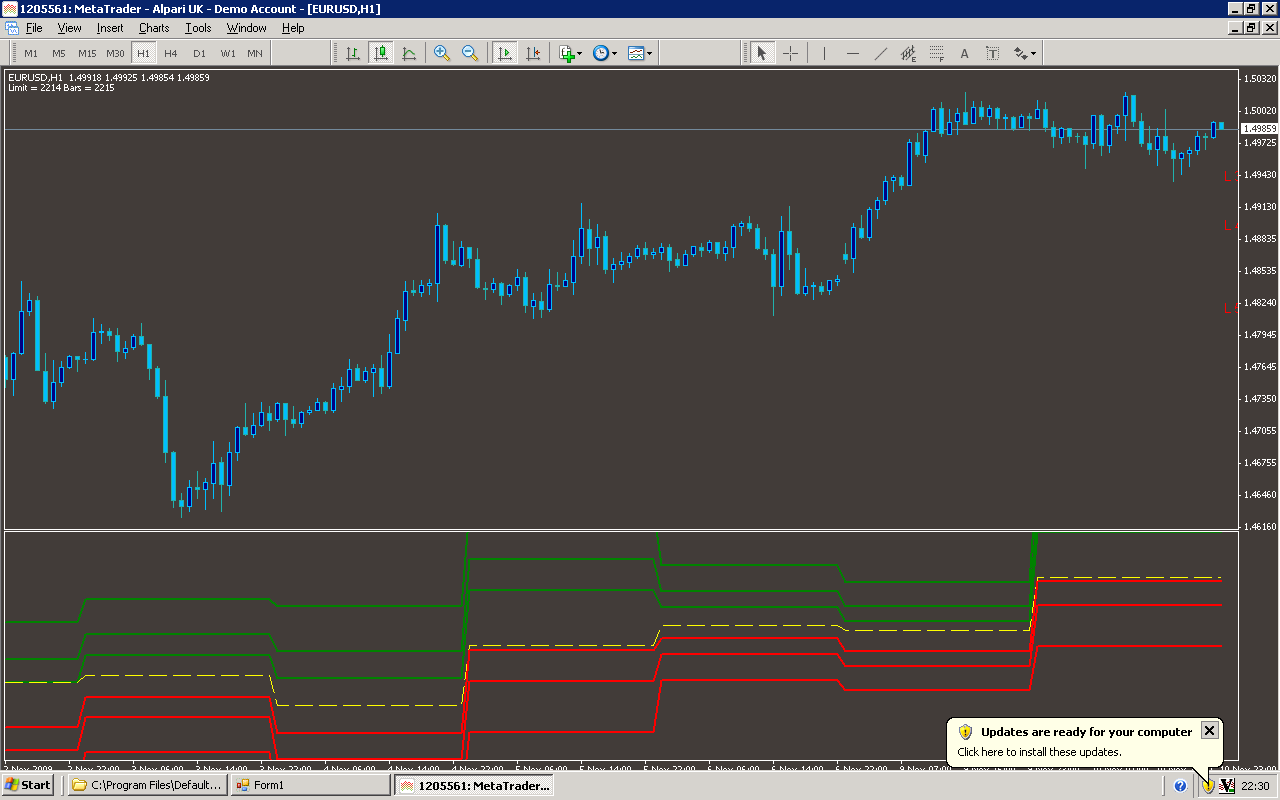
Analysis
Market Information Used:
Series array that contains the highest prices of each bar
Series array that contains the lowest prices of each bar
Series array that contains open time of each bar
Series array that contains close prices for each bar
Indicator Curves created:
Implements a curve of type DRAW_LINE
Indicators Used:
Custom Indicators Used:
Order Management characteristics:
Other Features:
It issuies visual alerts to the screen