//+------------------------------------------------------------------+
//| i4_GoldenLionTrend_v3
//| goldenlion@ukr.net
//| http://GlobeInvestFund.com/
//+------------------------------------------------------------------+
#property copyright "Copyright c 2006,      http://GlobeInvestFund.com/,     goldenlion@ukr.net"
#property link      "http://GlobeInvestFund.com/"


#property indicator_chart_window
#property indicator_buffers 4
#property indicator_color1 LightBlue
#property indicator_color2 Pink
#property indicator_color3 Blue
#property indicator_color4 Red


//---- input parameters
extern int MyPeriod=24;

extern double Dev1=1;
extern double Dev2=2;

//---- buffers
double val1[];
double val2[];

double val3[];
double val4[];

double bh1, bl1, bh2, bl2, bm, bh3, bl3;


//+------------------------------------------------------------------+
//| Custom indicator initialization function                         |
//+------------------------------------------------------------------+
int init()
  {
   string short_name;
//---- indicator line
   IndicatorBuffers(4);

   SetIndexStyle(0,DRAW_HISTOGRAM,EMPTY,2);
   SetIndexStyle(1,DRAW_HISTOGRAM,EMPTY,2);

   SetIndexStyle(2,DRAW_HISTOGRAM,EMPTY,2);
   SetIndexStyle(3,DRAW_HISTOGRAM,EMPTY,2);

   SetIndexBuffer(0,val1);
   SetIndexBuffer(1,val2);

   SetIndexBuffer(2,val3);
   SetIndexBuffer(3,val4);
//----
   return(0);
  }
//+------------------------------------------------------------------+
//| SilverTrend                                                      |
//+------------------------------------------------------------------+
int start()
  {
   int i1,i2,K;
   double Range,AvgRange,smin,smax,SsMax,SsMin,price;
   bool uptrend,old;
  int shift, ii, counted_bars=IndicatorCounted();
  double V1, V2;

//----
   if( Bars <= MyPeriod ) return(0);

   shift=Bars-MyPeriod*1.1;

   if( counted_bars >= MyPeriod ) shift=Bars-MyPeriod*1.1;


while(shift>=0)
{
  bm  = iBands(NULL,0,MyPeriod,0,0,PRICE_CLOSE,MODE_UPPER,shift);

  bh1 = iBands(NULL,0,MyPeriod,Dev1,0,PRICE_CLOSE,MODE_UPPER,shift);
  bl1 = iBands(NULL,0,MyPeriod,Dev1,0,PRICE_CLOSE,MODE_LOWER,shift);

  bh2 = iBands(NULL,0,MyPeriod,Dev2,0,PRICE_CLOSE,MODE_UPPER,shift);
  bl2 = iBands(NULL,0,MyPeriod,Dev2,0,PRICE_CLOSE,MODE_LOWER,shift);


  val1[shift]=0;
  val2[shift]=0;

  val3[shift]=0;
  val4[shift]=0;

if( Low[shift] > bh1 )
   {
   val1[shift]=High[shift];
   val2[shift]=Low[shift];
   }


if( High[shift] < bl1 )
   {
   val1[shift]=Low[shift];
   val2[shift]=High[shift];
   }


if( Low[shift] > bh2 )
   {
   val1[shift]=0;
   val2[shift]=0;
   val3[shift]=High[shift];
   val4[shift]=Low[shift];
   }


if( High[shift] < bl2 )
   {
   val1[shift]=0;
   val2[shift]=0;
   val3[shift]=Low[shift];
   val4[shift]=High[shift];
   }


   shift--;

}
   return(0);
  }
//+------------------------------------------------------------------+
Sample
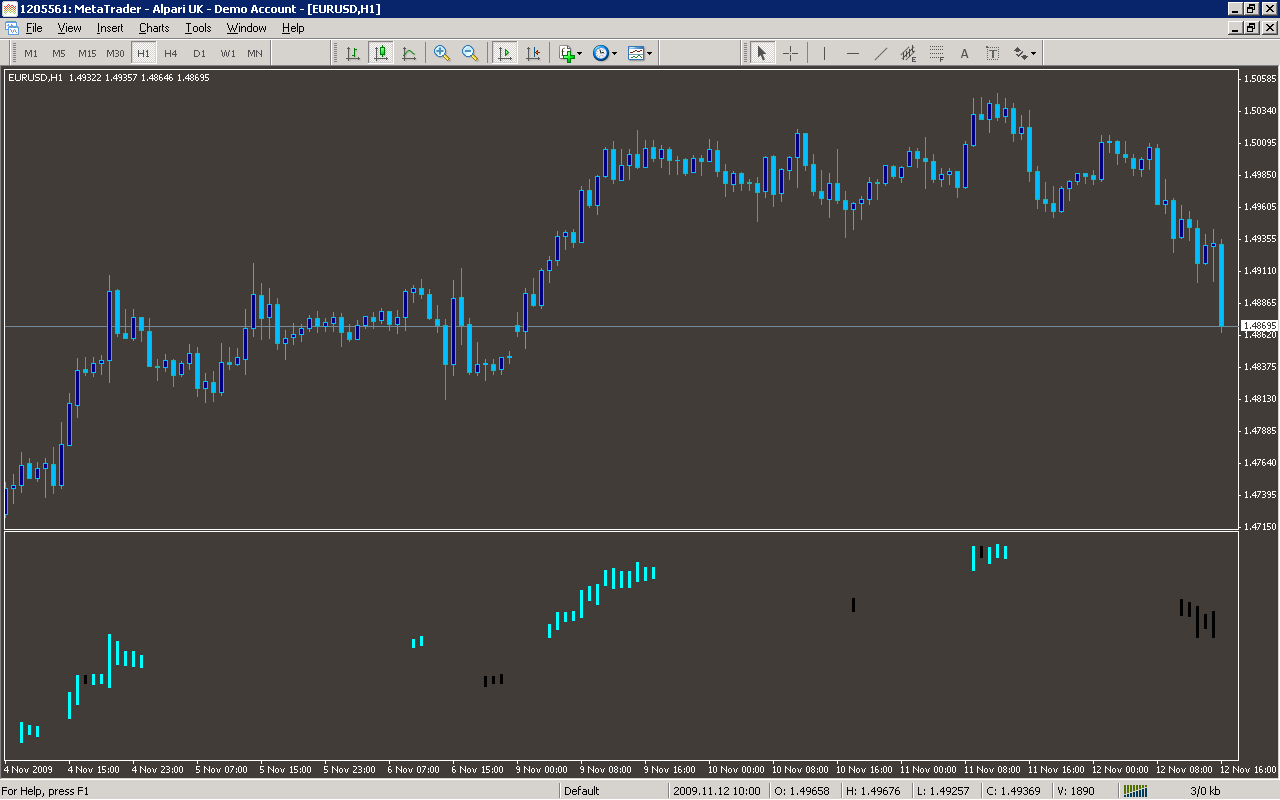
Analysis
Market Information Used:
Series array that contains the lowest prices of each bar
Series array that contains the highest prices of each bar
Indicator Curves created:
Implements a curve of type DRAW_HISTOGRAM
Indicators Used:
Bollinger bands indicator
Custom Indicators Used:
Order Management characteristics:
Other Features: