//+------------------------------------------------------------------+
//|                                                      iAvgVol.mq4 |
//|                                           Copyright © 2005, Anri |
//|                                    http://tradestation.narod.ru/ |
//+------------------------------------------------------------------+
#property copyright "Copyright © 2005, Anri"
#property link      "http://tradestation.narod.ru/"

#property indicator_separate_window
#property indicator_buffers 2
#property indicator_color1 Blue
#property indicator_color2 Red
//---- input parameters
extern int nPeriod = 5;
//---- buffers
double ExtMapBuffer1[];
double ExtMapBuffer2[];
//+------------------------------------------------------------------+
//| Custom indicator initialization function                         |
//+------------------------------------------------------------------+
int init()
  {
   string short_name;
//---- indicators
   SetIndexStyle(0, DRAW_LINE);
   SetIndexBuffer(0, ExtMapBuffer1);
   SetIndexStyle(1, DRAW_LINE);
   SetIndexBuffer(1, ExtMapBuffer2);
//---- name for DataWindow and indicator subwindow label
   short_name = "iAvgVol(" + nPeriod + ")";
   IndicatorShortName(short_name);
   SetIndexLabel(0, "Volume");
   SetIndexLabel(1, "AvgVolume");
//----
   return(0);
  }
//+------------------------------------------------------------------+
//| Custor indicator deinitialization function                       |
//+------------------------------------------------------------------+
int deinit()
  {
//----
   return(0);
  }
//+------------------------------------------------------------------+
//| Custom indicator iteration function                              |
//+------------------------------------------------------------------+
int start()
  {
   int counted_bars = IndicatorCounted();
   int    i, shift;
   double nSum;
//---- initial zero
   if(counted_bars < 1) // åñëè òåêóùèé áàð ìåíüøå åäèíèöû, óñòàíàâëèâàåì âñå â íóëè
     {
       for(i = 1; i <= 0; i++)
         {
           ExtMapBuffer1[Bars-i] = 0;
           ExtMapBuffer2[Bars-i] = 0;
         }
     }
//---- âû÷èñëåíèÿ
   for(shift = Bars - 1; shift >= 0; shift--)
     {
       nSum = Volume[shift];
       ExtMapBuffer1[shift] = nSum;
       if((nPeriod > 0) && (shift < (Bars - nPeriod - 1)))
         {
           for(i = nPeriod - 1; i >= 1; i--)
             {
               nSum = nSum + ExtMapBuffer1[shift+i];
	            }
	          nSum = nSum / nPeriod;
	        }
       ExtMapBuffer2[shift] = nSum;
     }
   return(0);
  }
//+------------------------------------------------------------------+
Sample
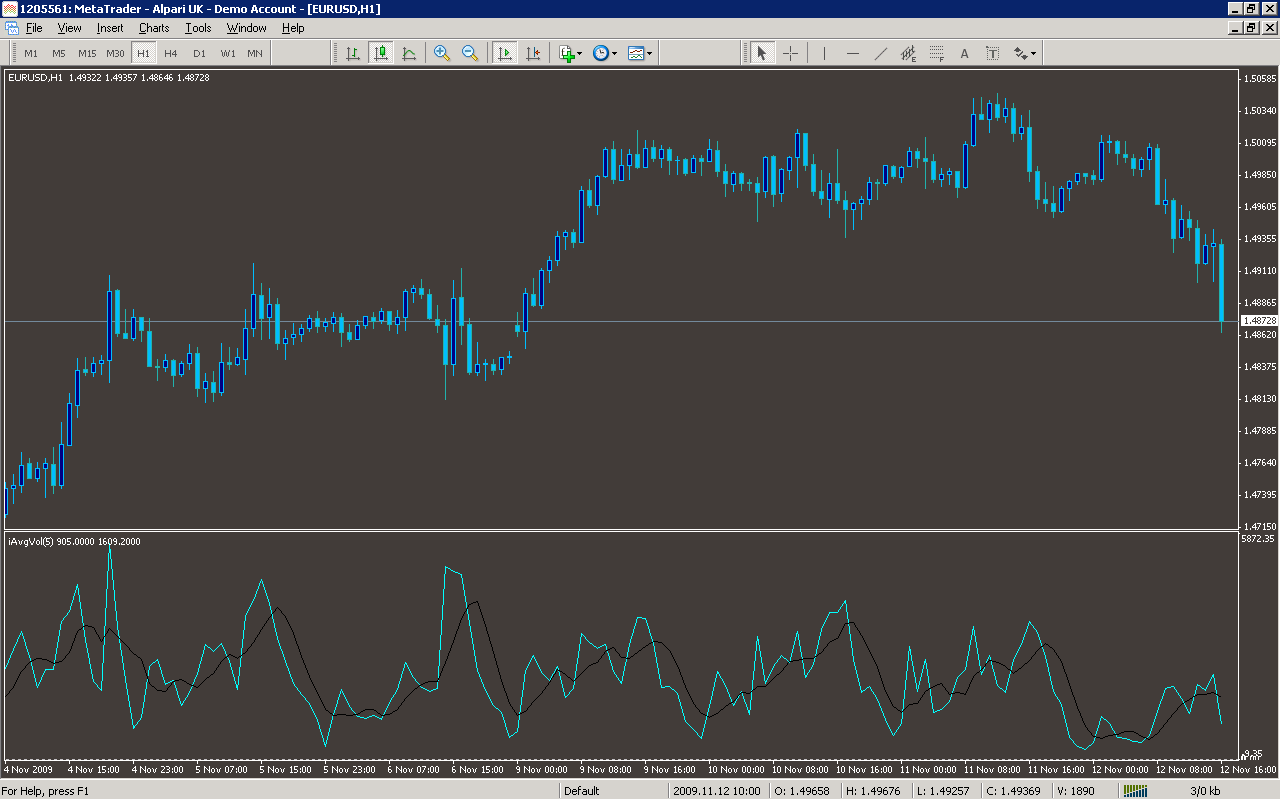
Analysis
Market Information Used:
Series array that contains tick volumes of each bar
Indicator Curves created:
Implements a curve of type DRAW_LINE
Indicators Used:
Custom Indicators Used:
Order Management characteristics:
Other Features: