/*-----------------------------+
|			       |
| Shared by www.Aptrafx.com    |
|			       |
+------------------------------*/

// Trend Manager.mq4
// Based on indicator sold at traderstradingsystem.com

#property indicator_chart_window
#property indicator_buffers 2
#property indicator_color1 Red
#property indicator_color2 Blue

extern int TM_Period = 7;
extern int TM_Shift = 2;

double SpanA_Buffer[];
double SpanB_Buffer[];
int a_begin;

int init()
{
   a_begin=TM_Shift;
   SetIndexStyle(0,DRAW_HISTOGRAM,STYLE_SOLID);
   SetIndexBuffer(0,SpanB_Buffer);
   SetIndexDrawBegin(0,TM_Period+a_begin-1);
   SetIndexLabel(0,"TM_Period+");
   SetIndexStyle(1,DRAW_HISTOGRAM,STYLE_SOLID);
   SetIndexBuffer(1,SpanA_Buffer);
   SetIndexDrawBegin(1,TM_Period+a_begin-1);
   SetIndexLabel(1,"TM_Period");

   return(0);
}

int start()
{
   int    i,k;
   int    counted_bars=IndicatorCounted();
   double high,low,price;
   string sColor;

   if(Bars<=TM_Period) return(0);
   if(counted_bars<1)
   {
      for(i=1;i<=TM_Period;i++)
      {
         SpanA_Buffer[Bars-i]=0;
         SpanB_Buffer[Bars-i]=0;
      }
   }

   // JUSTIN NOTES
   // BASICALLY, I THINK THE FORMULA IS TO GO BACK 7 BARS, SUM THE HIGH LOW, DIVIDE BY 2
   // THEN GET THAT SAME VALUE, BUT 2 BARS PREVIOUSLY, IF THE FIRST VALUE IS GREATER IT'S A BUY
   // OTHER WISE IT'S A SELL, IF EQUAL, NEAUTRAL

   i=Bars-TM_Period;
   if(counted_bars>TM_Period) i=Bars-counted_bars-1;
   while(i>=0)
   {
      high=High[i]; low=Low[i]; k=i-1+TM_Period;
      while(k>=i)
      {
         price=High[k];
         if(high<price) high=price;
         price=Low[k];
         if(low>price)  low=price;
         k--;
      }
      SpanA_Buffer[i]  = (high+low)/2.0;
      SpanB_Buffer[i]  = SpanA_Buffer[i+TM_Shift];

      //Print("Span A Buffer[", i, "] = ", (high+low)/2.0);
      //Print("Span B Buffer[", i, "] = ", SpanA_Buffer[i+TM_Shift]);

      //Print("Span A Price = ", SpanA_Buffer[Bars-TM_Period], " -- Span B Price = ", SpanB_Buffer[Bars-TM_Period]);

      if ( SpanA_Buffer[i] > SpanB_Buffer[i] )
      {
         sColor = "BUY";
      }
      else if ( SpanA_Buffer[i] < SpanB_Buffer[i] )
      {
         sColor = "SELL";
      }
      else
      {
         sColor = "NEUTRAL";
      }


      Print(sColor, " -- Bar = ", i, " -- Span A Price (Blue) = ", SpanA_Buffer[i], " -- Span B Price (Red) = ", SpanB_Buffer[i]);

      i--;
   }

   return(0);
}
Sample
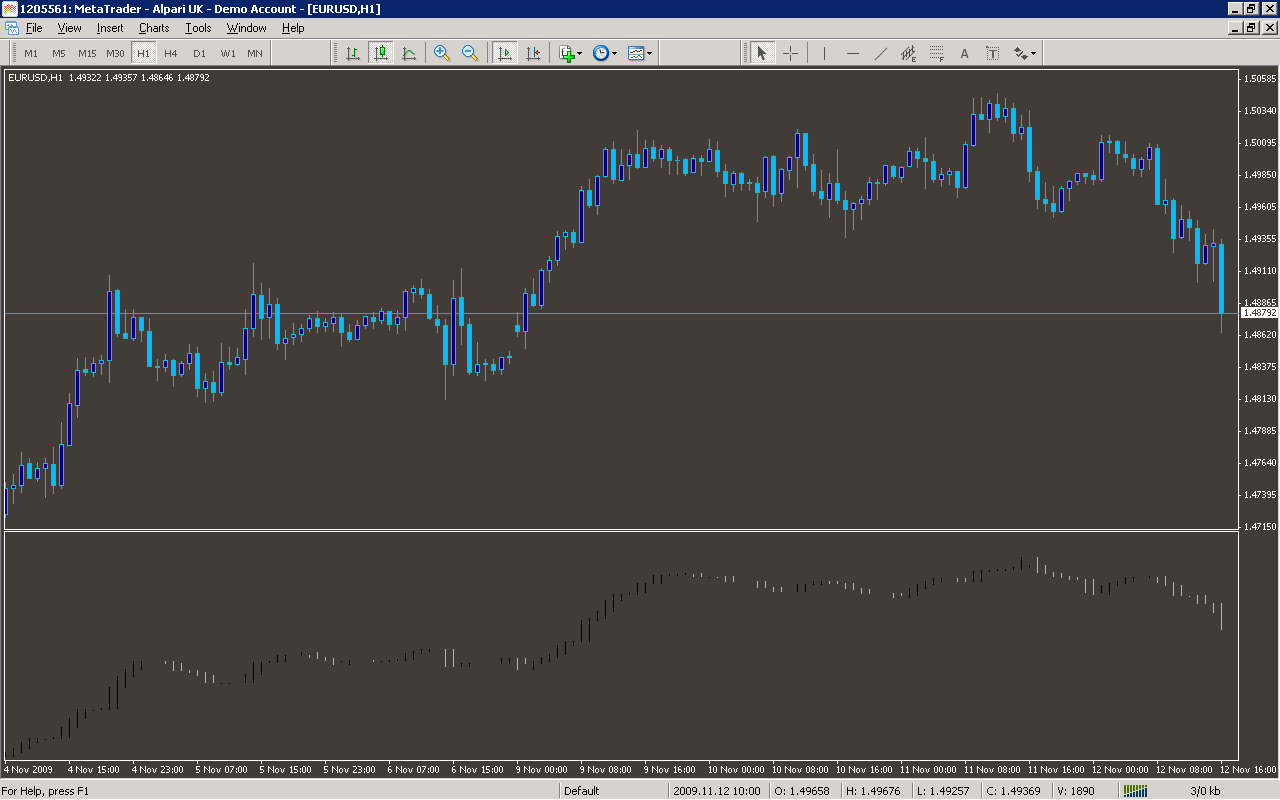
Analysis
Market Information Used:
Series array that contains the highest prices of each bar
Series array that contains the lowest prices of each bar
Indicator Curves created:
Implements a curve of type DRAW_HISTOGRAM
Indicators Used:
Custom Indicators Used:
Order Management characteristics:
Other Features: