#property  copyright "Copyright © 2007, TradersForecast"
#property  link      "http://www.TradersForecast.net/"
//---- indicator settings
//#property  indicator_separate_window
#property indicator_chart_window
#property  indicator_buffers 2
#property  indicator_color1  Red //Silver
#property  indicator_color2  Red //Lime      //Green
#property  indicator_width1  1
#property  indicator_width2  1
//---- indicator parameters
extern int hist4O=3;
extern int hist4C=3;
extern int maxSL=9;
//---- indicator buffers
double     highBuf[];
double     lowBuf[];
double high = 0;
double low = 0;

int init()
  {
//---- drawing settings
   SetIndexStyle(0,DRAW_LINE);
   SetIndexStyle(1,DRAW_LINE);
   //SetIndexDrawBegin(1,SignalSMA);
   //IndicatorDigits(Digits+1);
//---- indicator buffers mapping
   SetIndexBuffer(0,highBuf);
   SetIndexBuffer(1,lowBuf);
//---- name for DataWindow and indicator subwindow label
   //IndicatorShortName("MACD("+FastEMA+","+SlowEMA+","+SignalSMA+")");      //, "fExpert(5) = ", fExpert(5)
   IndicatorShortName("(highBuf = "+highBuf[0]+"; lowBuf = "+lowBuf[0]+";)");      //, "fExpert(5) = ", fExpert(5)
   SetIndexLabel(0,"Highs");
   SetIndexLabel(1,"Lows");
//---- initialization done
   return(0);
  }
//+------------------------------------------------------------------+
//|                                                                  |
//+------------------------------------------------------------------+

int start()
  {
   int limit;
   int counted_bars=IndicatorCounted();
//---- last counted bar will be recounted
   if(counted_bars>0) counted_bars--;
   limit = Bars-counted_bars;
//---- macd counted in the 1-st buffer
   for(int i=0 ; i<limit; i++){
      //dirBuffer[i] =
      fExpert(i+1);
      highBuf[i] = high;
      lowBuf[i] = low;
   }
//---- done
   return(0);
  }
//+------------------------------------------------------------------+

int fExpert(int v) {
   //if (v == 0)    return(0);
   int highPos = iHighest(NULL, 0, MODE_HIGH, hist4O, v);
   int lowPos = iLowest(NULL, 0, MODE_LOW, hist4O, v);
   high = High[highPos];
   low = Low[lowPos];
   return(0);
}
 // the end.
//+------------------------------------------------------------------+
Sample
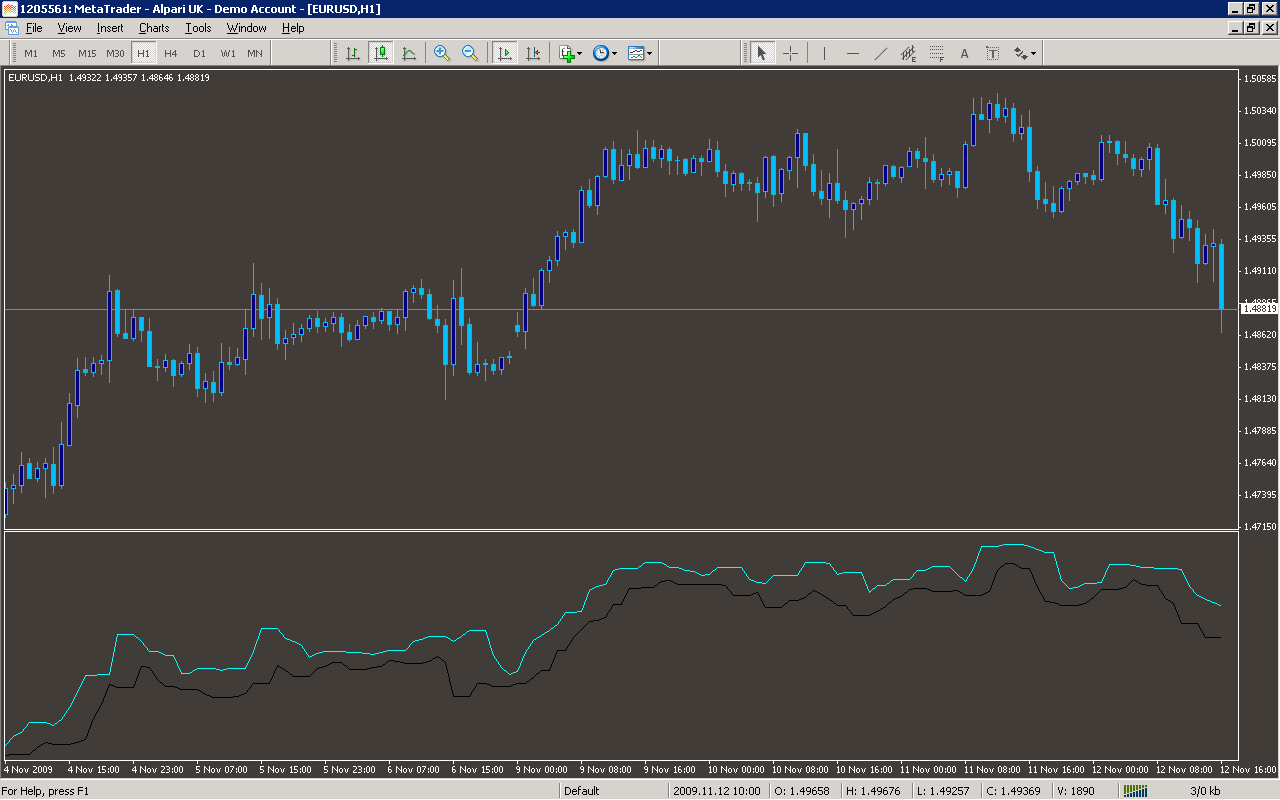
Analysis
Market Information Used:
Series array that contains the highest prices of each bar
Series array that contains the lowest prices of each bar
Indicator Curves created:
Implements a curve of type DRAW_LINE
Indicators Used:
Custom Indicators Used:
Order Management characteristics:
Other Features: