//-----------at_ALR+ma2-------------
#property indicator_separate_window
#property indicator_buffers 3
#property indicator_color1 SkyBlue
#property indicator_color2 Red
#property indicator_color3 Silver
//-------------------------------------
extern int hrLR=14;
extern double k=0.5;
extern double k2=0.5;
extern double kma=0.25;
//----------------------
double at[],ma3[],a0[];
double lr[10000],sx,sy,sxy,sx2,aa,bb;
double sum,sum2,ma[10000],ma2,sum3;
int p,pma,pma2,pma3;
//******************************************************************
int init() {
   SetIndexStyle(0,DRAW_HISTOGRAM);
   SetIndexBuffer(0,at);
   SetIndexStyle(1,DRAW_LINE);
   SetIndexBuffer(1,ma3);
   SetIndexBuffer(2,a0);
//-------------------------------------------
p=hrLR*60/Period(); pma=p*k; pma2=p*k2; pma3=p*kma;
//-------------------------------------------
return(0);}
//******************************************************************
int start() {
int cbi,i,n;
//int counted_bars=IndicatorCounted();
//if (counted_bars<0) return (-1);
//if (counted_bars>0) counted_bars--;
cbi=Bars-IndicatorCounted()-2;
//------------------------------------
for(i=cbi; i>=0; i--) {
if (i<Bars-p-1) {sx=0; sy=0; sxy=0; sx2=0;
for (n=0; n<=p-1; n++) {sx=sx+i+n; sy=sy+Close[i+n]; sxy=sxy+(i+n)*Close[i+n]; sx2=sx2+MathPow(i+n,2);}
aa=(sx*sy-p*sxy)/(MathPow(sx,2)-p*sx2); bb=(sy-aa*sx)/p;
lr[i]=bb+aa*i;}
if (i<Bars-p-pma-1) { sum=0.0; for (n=0; n<=pma-1; n++) {sum+=lr[i+n];} ma[i]=sum/pma;}
if (i<Bars-p-pma-pma2-1) { sum2=0.0; for (n=0; n<=pma2-1; n++) {sum2+=ma[i+n];} ma2=sum2/pma2;
at[i]=(ma[i]-ma2)/Point; }
if (i<Bars-p-pma-pma2-pma3-1) { sum3=0.0; for (n=0; n<=pma3-1; n++) {sum3+=at[i+n];} ma3[i]=sum3/pma3;}
a0[i]=0.0000001;
}
//--------------------------------------------------------------------
   return(0);}
//********************************************************************
Sample
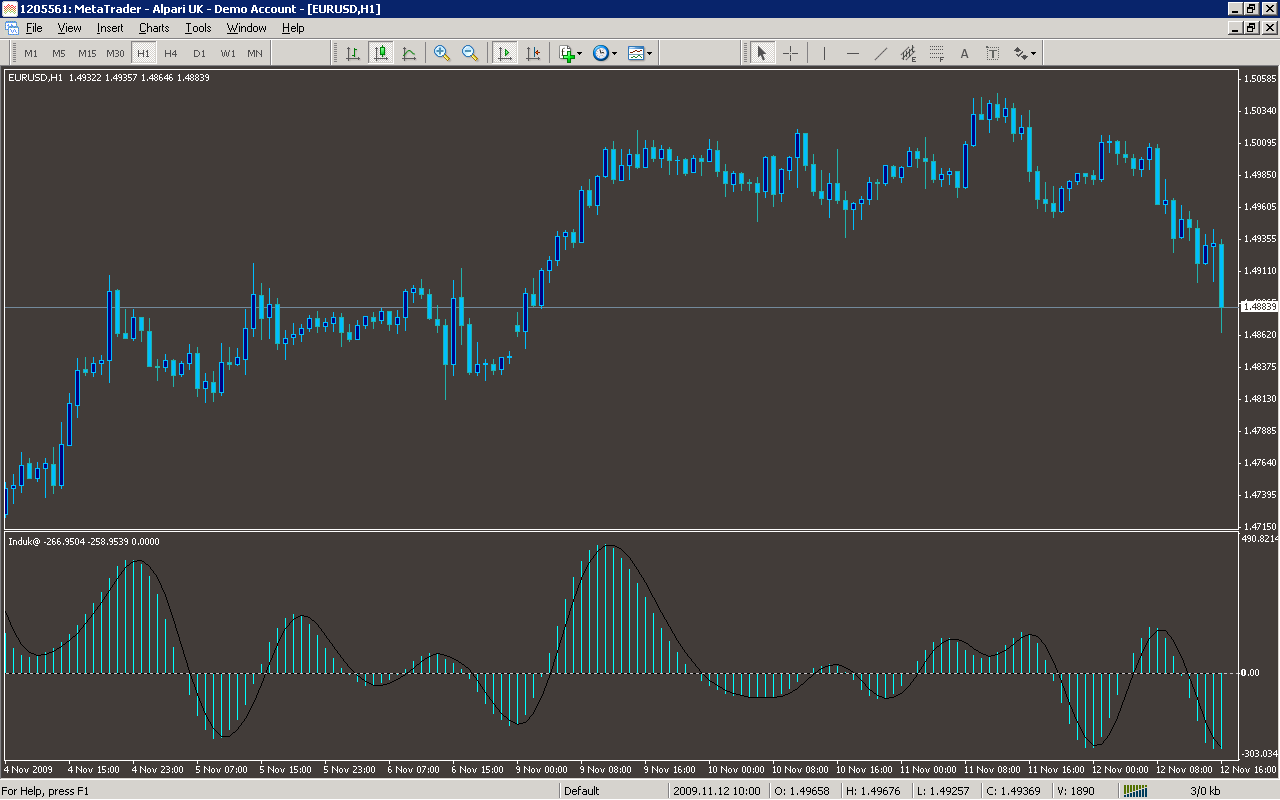
Analysis
Market Information Used:
Series array that contains close prices for each bar
Indicator Curves created:
Implements a curve of type DRAW_HISTOGRAM
Implements a curve of type DRAW_LINE
Indicators Used:
Custom Indicators Used:
Order Management characteristics:
Other Features: