//+------------------------------------------------------------------+
//|                    Written by forex.optimist@gmail.com           |
//+------------------------------------------------------------------+
#property copyright "forex.optimist@gmail.com"
#property link      "forex.optimist@gmail.com"

#property indicator_separate_window
#property indicator_buffers 1
#property indicator_color1 Red
#property indicator_width1 2
#property indicator_level1 40
#property indicator_level2 60
#property indicator_maximum 100
#property indicator_minimum 0
//---- buffers
double B1[];
double B2[];
extern int period=5;

//+------------------------------------------------------------------+
//| Custom indicator initialization function                         |
//+------------------------------------------------------------------+
int init()
  {
//---- indicators
   IndicatorBuffers(2);
   IndicatorShortName("Internal bar strength");
   SetIndexStyle(0,DRAW_LINE);
   SetIndexBuffer(0,B1);
   SetIndexLabel(0, "Internal bar strength");
   SetIndexBuffer(1,B2);
   ArraySetAsSeries(B2,false);
//----
   return(0);
  }
//+------------------------------------------------------------------+
//| Custor indicator deinitialization function                       |
//+------------------------------------------------------------------+
int deinit()
  {
//----

//----
   return(0);
  }
//+------------------------------------------------------------------+
//| Custom indicator iteration function                              |
//+------------------------------------------------------------------+
int start()
  {
     int limit;
     int counted_bars=IndicatorCounted();
     if(counted_bars<0) return(-1);
     if(counted_bars>0) counted_bars-=10;
     limit=Bars-counted_bars;
     for(int i=limit; i>=0; i--)
       {
       if (High[i] != Low[i])
         B2[i]=((Close[i]-Low[i]) / (High[i]-Low[i]));
       else
         B2[i] = B2[i+1];

       }
     for(i=limit; i>=0; i--)
       {
         B1[i] = iMAOnArray(B2,WHOLE_ARRAY,period,0,MODE_SMA,i)*100.0;
       }
  //----
    return(0);
  }
//+------------------------------------------------------------------+
Sample
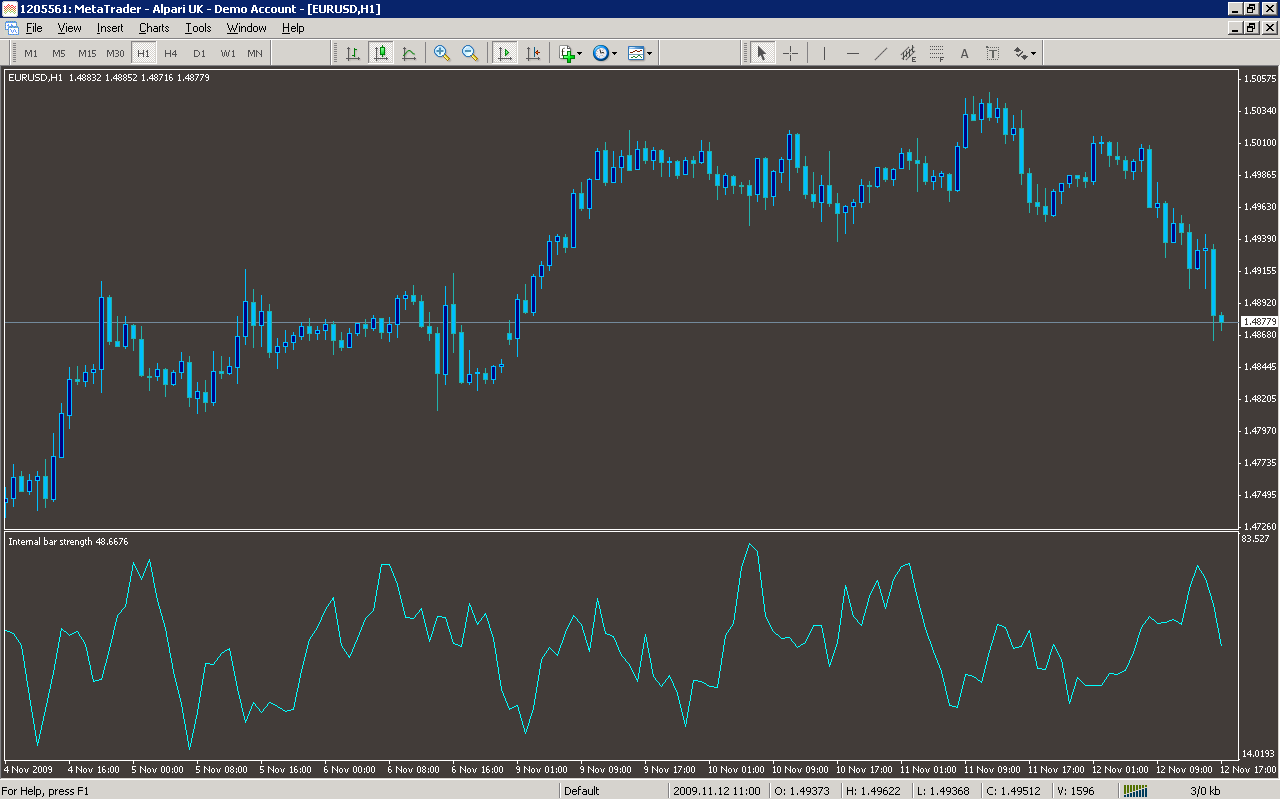
Analysis
Market Information Used:
Series array that contains the highest prices of each bar
Series array that contains the lowest prices of each bar
Series array that contains close prices for each bar
Indicator Curves created:
Implements a curve of type DRAW_LINE
Indicators Used:
Moving average indicator
Custom Indicators Used:
Order Management characteristics:
Other Features: