//+------------------------------------------------------------------+
//|                                                       iTrend.mq4 |
//|                      Copyright © 2004, MetaQuotes Software Corp. |
//|                                        http://www.metaquotes.net |
//+------------------------------------------------------------------+
#property copyright "Copyright © 2004, MetaQuotes Software Corp."
#property link      "http://www.metaquotes.net"

#property indicator_separate_window
#property indicator_buffers 2
#property indicator_color1 Blue
#property indicator_color2 Red
//---- input parameters
extern int Bands_Mode_0_2 = 0;  // =0-2 MODE_MAIN, MODE_LOW, MODE_HIGH
extern int Power_Price_0_6 = 0; // =0-6 PRICE_CLOSE,PRICE_OPEN,PRICE_HIGH,PRICE_LOW,PRICE_MEDIAN,PRICE_TYPICAL,PRICE_WEIGHTED
extern int Price_Type_0_3 = 0;  // =0-3 PRICE_CLOSE,PRICE_OPEN,PRICE_HIGH,PRICE_LOW
extern int Bands_Period = 20;
extern int Bands_Deviation = 2;
extern int Power_Period = 13;
extern int CountBars = 300;
//---- buffers
double value[];
double value2[];
//+------------------------------------------------------------------+
//| Custom indicator initialization function                         |
//+------------------------------------------------------------------+
int init()
  {
//   string short_name;
//---- indicator line
   IndicatorBuffers(2);
   SetIndexStyle(0, DRAW_HISTOGRAM);
   SetIndexStyle(1, DRAW_HISTOGRAM);
   SetIndexBuffer(0, value);
   SetIndexBuffer(1, value2);
//---- name for DataWindow and indicator subwindow label
   IndicatorShortName("iTrend (" + Bands_Period + ", " + Bands_Deviation + ")");
   SetIndexLabel(0, "iTrend1 (" + Bands_Period + ", " + Bands_Deviation + ")");
   SetIndexLabel(1, "iTrend2 (" + Bands_Period + ", " + Bands_Deviation + ")");
//----
   SetIndexDrawBegin(0, Bars - CountBars + Bands_Period + 1);
   SetIndexDrawBegin(1, Bars - CountBars + Bands_Period + 1);
//----
   return(0);
  }
//+------------------------------------------------------------------+
//| Trend                                                         |
//+------------------------------------------------------------------+
int start()
  {
   int i, CurrentBar, Bands_Mode, counted_bars = IndicatorCounted();
   double Power_Price, CurrentPrice;
//----
   if(Bars <= Bands_Period)
       return(0);
//---- initial zero
   if(counted_bars < Bands_Period)
     {
       for(i = 1; i <= Bands_Period; i++)
           value[Bars-i] = 0.0;
       for(i = 1; i <= Bands_Period; i++)
           value2[Bars-i] = 0.0;
     }
//----
   i = CountBars - Bands_Period - 1;
//   if(counted_bars>=Bands_Period) i=Bars-counted_bars-1;
   if(Bands_Mode_0_2 == 1)
       Bands_Mode = MODE_LOW;
   if(Bands_Mode_0_2 == 2)
       Bands_Mode = MODE_HIGH;
   if(Bands_Mode_0_2 == 0)
       Bands_Mode = MODE_MAIN;

   if(Power_Price_0_6 == 1)
       Power_Price = PRICE_OPEN;
   if(Power_Price_0_6 == 2)
       Power_Price = PRICE_HIGH;
   if(Power_Price_0_6 == 3)
       Power_Price = PRICE_LOW;
   if(Power_Price_0_6 == 4)
       Power_Price = PRICE_MEDIAN;
   if(Power_Price_0_6 == 5)
       Power_Price = PRICE_TYPICAL;
   if(Power_Price_0_6 == 6)
       Power_Price = PRICE_WEIGHTED;
   if(Power_Price_0_6 == 6)
       Power_Price = PRICE_CLOSE;

   for(i = CountBars - 1; i >= 0; i--)
     {
       if(Price_Type_0_3 == 1)
           CurrentPrice = Open[i];

       if(Price_Type_0_3 == 2)
           CurrentPrice = High[i];

       if(Price_Type_0_3 == 3)
           CurrentPrice = Low[i];
       if(Price_Type_0_3 == 0)
           CurrentPrice = Close[i];

       value[i] = CurrentPrice - iBands(NULL, 0, Bands_Period, Bands_Deviation,
                                        0, Bands_Mode, Power_Price, i);
       value2[i] = -(iBearsPower(NULL, 0, Power_Period, Power_Price, i) +
                     iBullsPower(NULL, 0, Power_Period, Power_Price, i));
     }
   return(0);
  }
//+------------------------------------------------------------------+
Sample
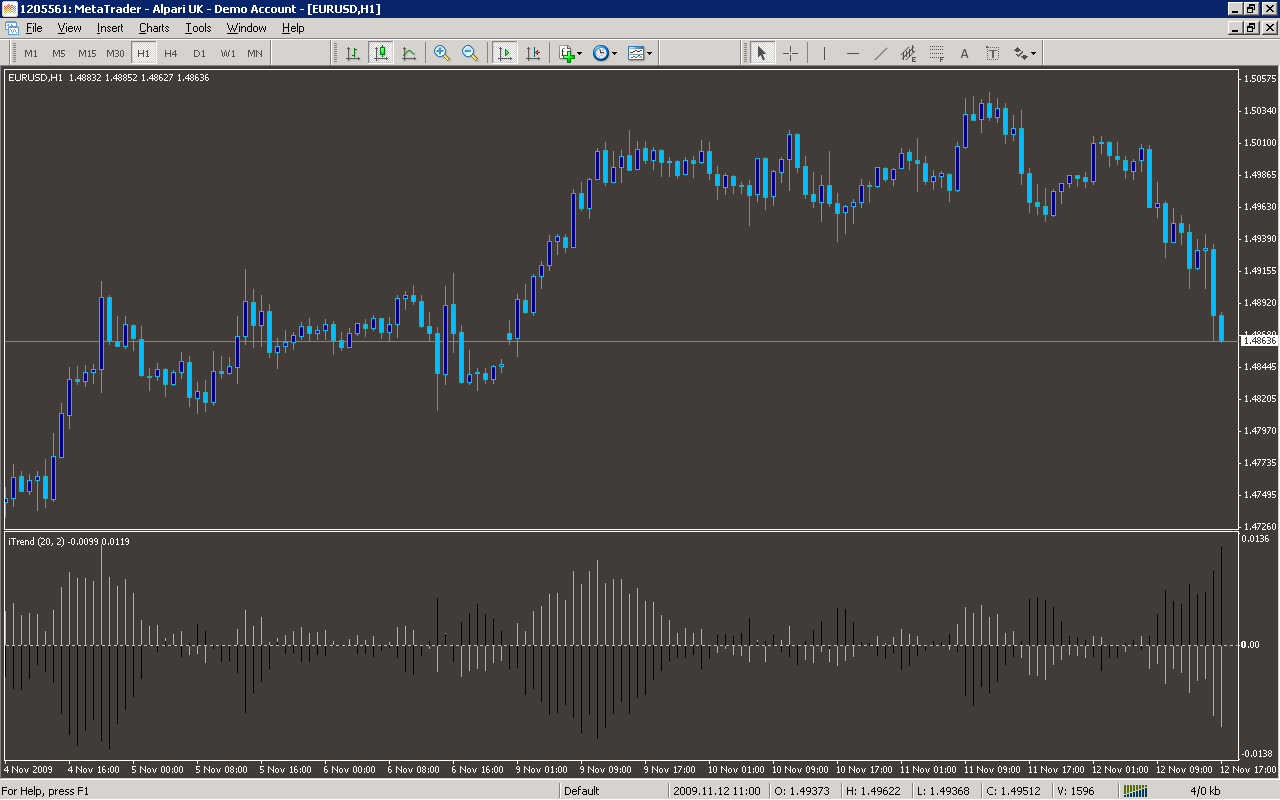
Analysis
Market Information Used:
Series array that contains open prices of each bar
Series array that contains the highest prices of each bar
Series array that contains the lowest prices of each bar
Series array that contains close prices for each bar
Indicator Curves created:
Implements a curve of type DRAW_HISTOGRAM
Indicators Used:
Bollinger bands indicator
Bears Power indicator
Bulls Power indicator
Custom Indicators Used:
Order Management characteristics:
Other Features: