//+------------------------------------------------------------------+
//|                                       Linear Regression Line.mq4 |
//+------------------------------------------------------------------+
#property copyright "MetaTrader 4"
#property link      "http://metatrader.com"
//---- indicator settings
#property indicator_chart_window
#property indicator_buffers 1
#property indicator_color1 Blue
#property indicator_width1 2
//---- input parameters
extern int LRLPeriod=21;
//---- buffers
double LRLBuffer[];

int shift=0;
int n=0;
double sumx=0, sumy=0, sumxy=0, sumx2=0, sumy2=0;
double m=0, yint=0, r=0;
//+------------------------------------------------------------------+
//| Custom indicator initialization function                         |
//+------------------------------------------------------------------+
int init()
  {
//---- indicators
   SetIndexStyle(0,DRAW_LINE);
   SetIndexBuffer(0,LRLBuffer);
   IndicatorDigits(Digits);
   if(LRLPeriod < 2) LRLPeriod=2;
   IndicatorShortName("Linear Regression Line ("+LRLPeriod+")");
   SetIndexDrawBegin(0,LRLPeriod+2);
   IndicatorDigits(MarketInfo(Symbol(),MODE_DIGITS)+4);
//----
   return(0);
  }
//+------------------------------------------------------------------+
//| Custom indicator deinitialization function                       |
//+------------------------------------------------------------------+
int deinit()
  {
   return(0);
  }
//+------------------------------------------------------------------+
//| Linear Regression Line                                           |
//+------------------------------------------------------------------+
int start()
  {
   int limit;
   int counted_bars=IndicatorCounted();
   if(counted_bars<0) counted_bars=0;
   if(counted_bars>0) counted_bars--;
   limit=Bars-counted_bars;

   for(int shift=limit-1; shift>=0; shift--)
     {
      sumx=0;
      sumy=0;
      sumxy=0;
      sumx2=0;
      sumy2=0;
      for(n=0; n<=LRLPeriod-1; n++)
        {
         sumx=sumx + n;
         sumy=sumy + Close[shift + n];
         sumxy=sumxy + n * Close[shift + n];
         sumx2=sumx2 + n * n;
         sumy2=sumy2 + Close[shift + n] * Close[shift + n];
        }
      m=(LRLPeriod*sumxy-sumx*sumy)/(LRLPeriod*sumx2-sumx*sumx);
      yint=(sumy+m*sumx)/LRLPeriod;
      r=(LRLPeriod*sumxy-sumx*sumy)/MathSqrt((LRLPeriod*sumx2-sumx*sumx)*(LRLPeriod*sumy2-sumy*sumy));
      LRLBuffer[shift]=yint-m*LRLPeriod;
     }
   return(0);
  }
//+------------------------------------------------------------------+
Sample
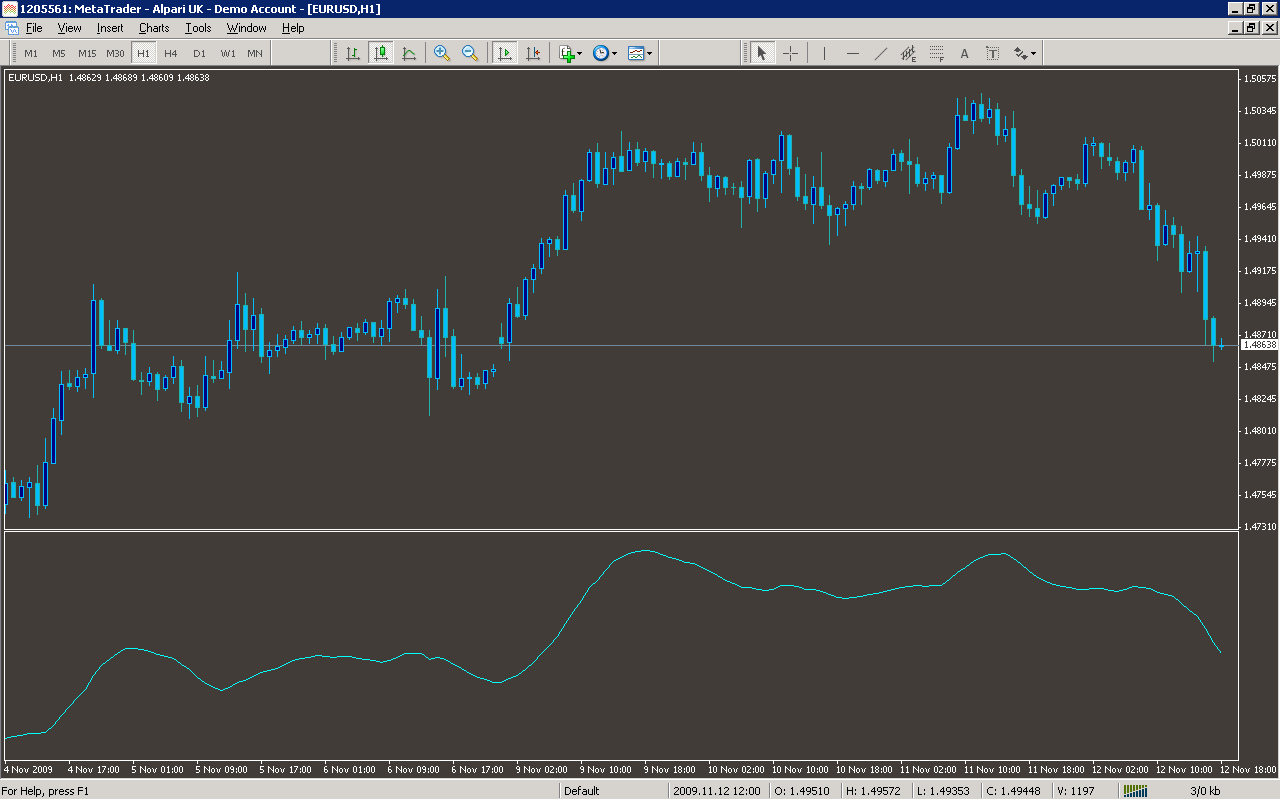
Analysis
Market Information Used:
Series array that contains close prices for each bar
Indicator Curves created:
Implements a curve of type DRAW_LINE
Indicators Used:
Custom Indicators Used:
Order Management characteristics:
Other Features: