/*-----------------------------+
|			       |
| Shared by www.Aptrafx.com    |
|			       |
+------------------------------*/

//+------------------------------------------------------------------+
//|                      Copyright © 2004, MetaQuotes Software Corp. |
//|                                       http://www.metaquotes.net/ |
//+------------------------------------------------------------------+

#property copyright "Copyright © 2004, MetaQuotes Software Corp."
#property link "http://www.metaquotes.net"
#property indicator_chart_window
#property indicator_buffers 3
#property indicator_color1 Yellow
#property indicator_color2 Green
#property indicator_color3 Red
#property indicator_width1 2
#property indicator_width2 2
#property indicator_width3 2

double ExtMapBuffer1[];
double ExtMapBuffer2[];
double ExtMapBuffer3[];

extern int Rperiod = 34;

int width;
int Draw4HowLong;
int shift;
int i;
int loopbegin;
int length;

double lengthvar;
double tmp;
double sum;
double wt[];

//+------------------------------------------------------------------+
//| Custom indicator initialization function |
//+------------------------------------------------------------------+

int init()
{
	IndicatorBuffers(4);

	SetIndexBuffer(2,ExtMapBuffer1);
	SetIndexBuffer(1,ExtMapBuffer2);
	SetIndexBuffer(0,ExtMapBuffer3);
	SetIndexBuffer(3,wt);


	// Start line => dot changes


	SetIndexStyle(0,DRAW_ARROW);
	SetIndexStyle(1,DRAW_ARROW);
	SetIndexStyle(2,DRAW_ARROW);

	SetIndexArrow(0,159);
	SetIndexArrow(1,159);
	SetIndexArrow(2,159);

	SetIndexLabel(0,"MAnone");
	SetIndexLabel(1,"MAup");
	SetIndexLabel(2,"MAdown");

	// End line => dot changes, Start old code:

/*
	SetIndexStyle(2,DRAW_LINE,STYLE_SOLID);
	SetIndexStyle(1,DRAW_LINE,STYLE_SOLID);
	SetIndexStyle(0,DRAW_LINE,STYLE_SOLID);
*/

	// End old code

	return(0);
}

int start()
{
	Draw4HowLong = Bars - Rperiod - 5;
	length = Rperiod;
	loopbegin = Draw4HowLong - length - 1;

	for(shift = loopbegin; shift >= 1; shift--)
	{
		sum = 0;
		for(i = length; i >= 1 ; i--)
		{
			lengthvar = length + 1;
			lengthvar /= 3;
			tmp = 0;
			tmp = ( i - lengthvar)*Close[length-i+shift];
			sum+=tmp;
		}
		wt[shift] = MathFloor(sum*6/(length*(length+1))/Point)*Point;


		if (wt[shift+1] > wt[shift])
		{
		ExtMapBuffer1[shift] = wt[shift]; //red
		}
		else if (wt[shift+1] < wt[shift])
		{
		ExtMapBuffer2[shift] = wt[shift]; //green
		}
		else
		{
		ExtMapBuffer3[shift] = wt[shift]; //yellow
		}
	}

	return(0);
}
Sample
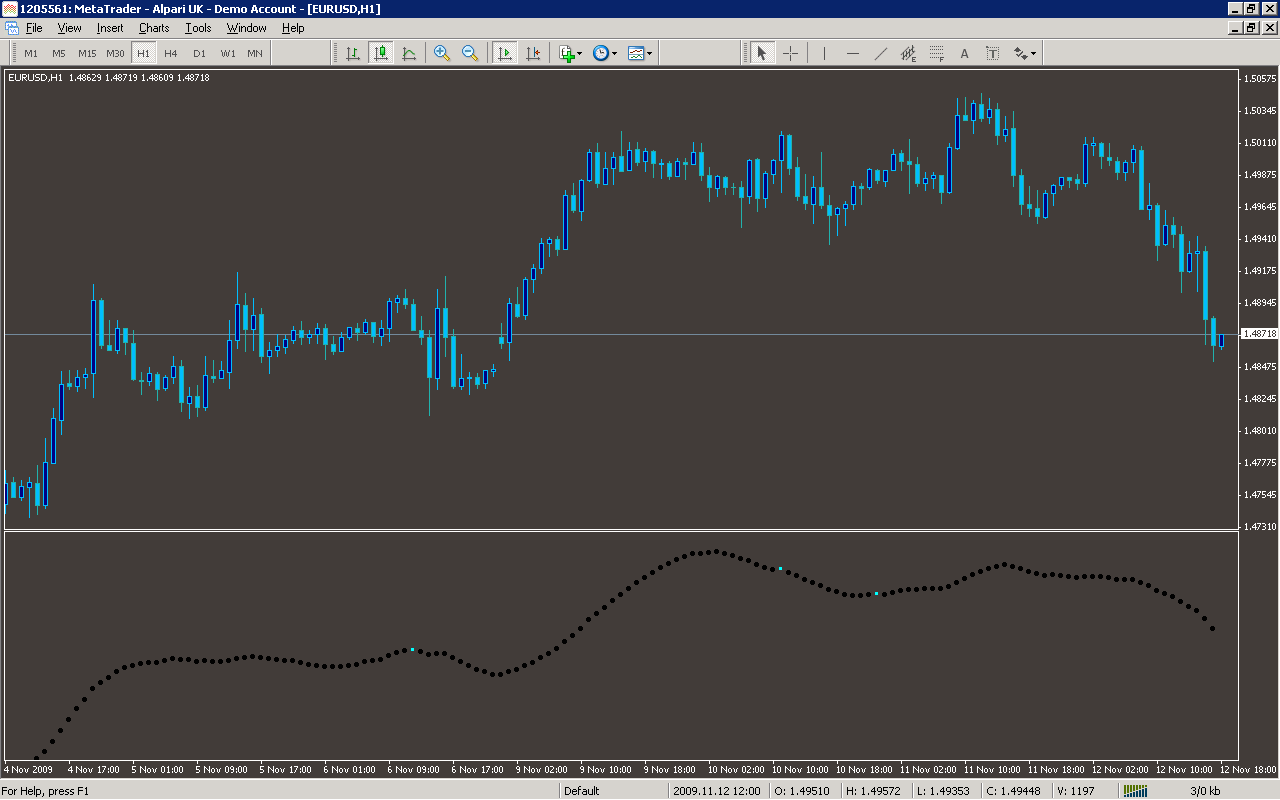
Analysis
Market Information Used:
Series array that contains close prices for each bar
Indicator Curves created:
Implements a curve of type DRAW_ARROW
Implements a curve of type DRAW_LINE
Indicators Used:
Custom Indicators Used:
Order Management characteristics:
Other Features: