//+------------------------------------------------------------------+
//|                                                   MA Chanels.mq4 |
//|                                                           °njel° |
//|                                                     iamnotlinked |
//+------------------------------------------------------------------+
#property copyright "°njel°"
#property link      "iamnotlinked"

#property indicator_chart_window
#property indicator_buffers 8

#property indicator_color1 Red
#property indicator_color2 Orange
#property indicator_color3 Yellow
#property indicator_color4 White
#property indicator_color5 White
#property indicator_color6 Yellow
#property indicator_color7 Orange
#property indicator_color8 Red
//---- input parameters
extern int BarsCount = 500;
extern int       MAPeriod=100;

double  max =0;
double  min =0;

double    Inc0 = 0.0000;
double    Inc1 = 0.0000;
double    Inc2 = 0.0000;
double    Inc3 = 0.0000;
//---- buffers
double ExtMapBuffer1[];
double ExtMapBuffer2[];
double ExtMapBuffer3[];
double ExtMapBuffer4[];
double ExtMapBuffer5[];
double ExtMapBuffer6[];
double ExtMapBuffer7[];
double ExtMapBuffer8[];
//+------------------------------------------------------------------+
//| Custom indicator initialization function                         |
//+------------------------------------------------------------------+
int init()
  {
//---- indicators
   SetIndexStyle(0,DRAW_LINE);
   SetIndexBuffer(0,ExtMapBuffer1);
   SetIndexLabel(0,"61.8%");

   SetIndexStyle(1,DRAW_LINE);
   SetIndexBuffer(1,ExtMapBuffer2);
   SetIndexLabel(1,"50%");

   SetIndexStyle(2,DRAW_LINE);
   SetIndexBuffer(2,ExtMapBuffer3);
   SetIndexLabel(2,"38.2%");

   SetIndexStyle(3,DRAW_LINE);
   SetIndexBuffer(3,ExtMapBuffer4);
   SetIndexLabel(3,"23.5%");


   SetIndexStyle(4,DRAW_LINE);
   SetIndexBuffer(4,ExtMapBuffer5);
   SetIndexLabel(4,"23.5%");

   SetIndexStyle(5,DRAW_LINE);
   SetIndexBuffer(5,ExtMapBuffer6);
   SetIndexLabel(5,"38.2%");

   SetIndexStyle(6,DRAW_LINE);
   SetIndexBuffer(6,ExtMapBuffer7);
   SetIndexLabel(6,"50%");

   SetIndexStyle(7,DRAW_LINE);
   SetIndexBuffer(7,ExtMapBuffer8);
   SetIndexLabel(7,"61.8%");
//----
   return(0);
  }
//+------------------------------------------------------------------+
//| Custom indicator deinitialization function                       |
//+------------------------------------------------------------------+
int deinit()
  {
   max =0;
   min =0;
   return(0);
  }
//+------------------------------------------------------------------+
//| Custom indicator iteration function                              |
//+------------------------------------------------------------------+
int start()
  {


   max =0;
   min =0;


   if (iBars(NULL,0) < BarsCount)
      BarsCount = iBars(NULL,0) -MAPeriod-1 ;

   for (int i =BarsCount; i>=0; i--)
   {

      double m = iMA(NULL,0,MAPeriod,0,MODE_SMA,PRICE_CLOSE,i);
      double top = High[i] - m;
      if (top > max)
         max = top;

      double bottom = Low[i] - m;
      if (bottom < min)
         min = bottom;

   }

   if (MathAbs(max) >  MathAbs(min))
      Inc3 = max;
   else
      Inc3 = min;


      Inc2 = Inc3*0.618;
      Inc1 = Inc3*0.5;
      Inc0 = Inc3*0.236;
      Inc3 = Inc3*0.382;


   for (i =BarsCount; i>=0; i--)
   {
      ExtMapBuffer1[i] = iMA(NULL,0,MAPeriod,0,MODE_SMA,PRICE_CLOSE,i) + Inc2;
      ExtMapBuffer2[i] = iMA(NULL,0,MAPeriod,0,MODE_SMA,PRICE_CLOSE,i) + Inc1;
      ExtMapBuffer3[i] = iMA(NULL,0,MAPeriod,0,MODE_SMA,PRICE_CLOSE,i) + Inc3;
      ExtMapBuffer4[i] = iMA(NULL,0,MAPeriod,0,MODE_SMA,PRICE_CLOSE,i) + Inc0;


      ExtMapBuffer5[i] = iMA(NULL,0,MAPeriod,0,MODE_SMA,PRICE_CLOSE,i) - Inc0;
      ExtMapBuffer6[i] = iMA(NULL,0,MAPeriod,0,MODE_SMA,PRICE_CLOSE,i) - Inc3;
      ExtMapBuffer7[i] = iMA(NULL,0,MAPeriod,0,MODE_SMA,PRICE_CLOSE,i) - Inc1;
      ExtMapBuffer8[i] = iMA(NULL,0,MAPeriod,0,MODE_SMA,PRICE_CLOSE,i) - Inc2;


   }

   return(0);
  }
//+------------------------------------------------------------------+
Sample
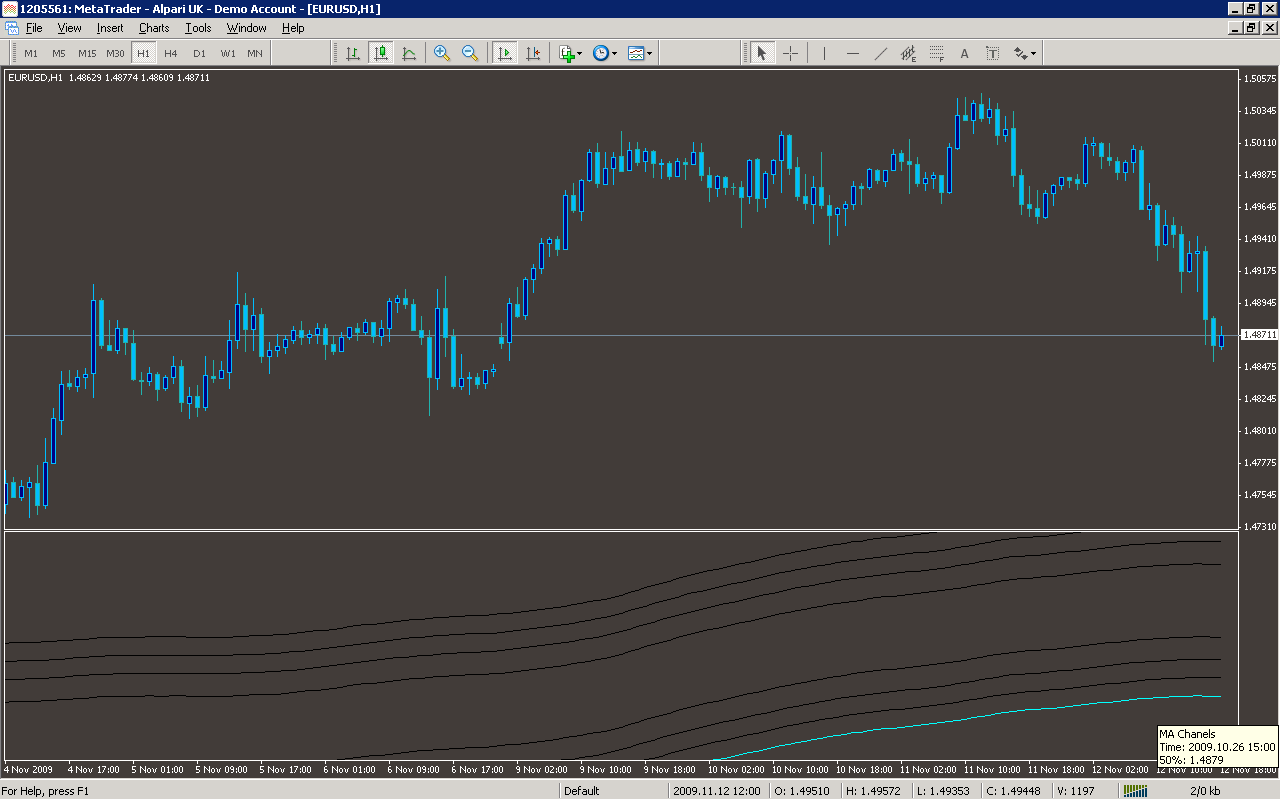
Analysis
Market Information Used:
Series array that contains the highest prices of each bar
Series array that contains the lowest prices of each bar
Indicator Curves created:
Implements a curve of type DRAW_LINE
Indicators Used:
Moving average indicator
Custom Indicators Used:
Order Management characteristics:
Other Features: