//+------------------------------------------------------------------+
//|                                                MarketProfile.mq4 |
//|                             Copyright © 2006, Viatcheslav Suvorov|
//+------------------------------------------------------------------+
#property copyright "Viatcheslav Suvorov"

#property indicator_chart_window


extern datetime StartDate = D'';
extern bool lastdayStart = true;
extern int CountProfile = 2;


int fontsize=10;
int i,j;
double LastHigh,LastLow,CurPos;
bool signal;
//+------------------------------------------------------------------+
//| Custor indicator deinitialization function                       |
//+------------------------------------------------------------------+
int deinit()
  {
ObjectsDeleteAll(0,OBJ_RECTANGLE);
   return(0);
  }
//+------------------------------------------------------------------+
//| Custom indicator initialization function                         |
//+------------------------------------------------------------------+
int init()
  {
   string short_name;


//---- name for DataWindow and indicator subwindow label
   short_name="MarketProfile";
   IndicatorShortName(short_name);
   SetIndexLabel(0,short_name);

   return(0);
  }

//+------------------------------------------------------------------+
//| Custom indicator iteration function                              |
//+------------------------------------------------------------------+
int start()

  {
  deinit();
double onetick;
double Mediana=0;
int MaxSize=0;
int MySize=0;
int MySizeEuropa=0;
int MySizeAzia=0;
int MySizeAmerica=0;
int BACK=0;
if (lastdayStart) StartDate=Time[0];

int x=Period();
if (x>60) return(-1);
if (x<15) return(-1);


  BACK=0;
  while (TimeDayOfYear(Time[BACK])>TimeDayOfYear(StartDate) || TimeYear(Time[BACK])!=TimeYear(StartDate) && (BACK<Bars)) {
    BACK++;
    if (BACK>=Bars) return(0);
  }//while


onetick = 1/(MathPow(10,Digits));
i=BACK;
////
int cycles;

for (cycles=CountProfile;cycles>0;cycles--) {

signal=false;
LastHigh=High[i];
LastLow=Low[i];
while (!signal)
{
//if (i+1==Bars) signal=true;
if (High[i+1]>LastHigh) LastHigh=High[i+1];
if (Low[i+1]<LastLow) LastLow=Low[i+1];
MaxSize=0;
MySize=0;

if (TimeDay(Time[i])!=TimeDay(Time[i+1]))
   {

   signal=true;
   CurPos=LastLow;
   while (CurPos<=LastHigh){
     MySizeAzia=0;
     MySizeEuropa=0;
     MySizeAmerica=0;
     for (j=i;j>=BACK;j--) {
       if ((High[j]>=CurPos) && (Low[j]<=CurPos)) {
         MySize++;
         if (TimeHour(Time[j])>=13)  MySizeAmerica++; else
         if ((TimeHour(Time[j])>=8) && (TimeHour(Time[j])<13)) MySizeEuropa++; else
           MySizeAzia++;

       }//if
     }//for
     if (MySizeAzia+MySizeEuropa+MySizeAmerica>MaxSize){
       MaxSize=MySizeAzia+MySizeEuropa+MySizeAmerica;
       Mediana=CurPos;
     }
     if (i-MySizeAzia>=0)
     if(ObjectFind("rec"+"Azia"+TimeToStr(Time[i],TIME_DATE)+CurPos) == -1 && MySizeAzia!=0) {
           ObjectCreate("rec"+"Azia"+TimeToStr(Time[i],TIME_DATE)+CurPos, OBJ_RECTANGLE, 0, Time[i], CurPos,Time[i-MySizeAzia],CurPos+onetick);
           ObjectSet("rec"+"Azia"+TimeToStr(Time[i],TIME_DATE)+CurPos, OBJPROP_COLOR, Olive);
     }//if
     if(ObjectFind("rec"+"Europa"+TimeToStr(Time[i],TIME_DATE)+CurPos) == -1 && MySizeEuropa!=0) {
           ObjectCreate("rec"+"Europa"+TimeToStr(Time[i],TIME_DATE)+CurPos, OBJ_RECTANGLE, 0, Time[i-MySizeAzia], CurPos,Time[i-MySizeAzia-MySizeEuropa],CurPos+onetick);
           ObjectSet("rec"+"Europa"+TimeToStr(Time[i],TIME_DATE)+CurPos, OBJPROP_COLOR, Navy);
     }//if
     if(ObjectFind("rec"+"America"+TimeToStr(Time[i],TIME_DATE)+CurPos) == -1 && MySizeAmerica!=0) {
           ObjectCreate("rec"+"America"+TimeToStr(Time[i],TIME_DATE)+CurPos, OBJ_RECTANGLE, 0, Time[i-MySizeAzia-MySizeEuropa], CurPos,Time[i-MySizeAzia-MySizeEuropa-MySizeAmerica],CurPos+onetick);
           ObjectSet("rec"+"America"+TimeToStr(Time[i],TIME_DATE)+CurPos, OBJPROP_COLOR, Maroon);
     }//if


     CurPos=CurPos+onetick;
   }//while
      ObjectCreate("mediana"+TimeToStr(Time[i],TIME_DATE), OBJ_RECTANGLE, 0, Time[i], Mediana,Time[i+10],Mediana+onetick);
      ObjectSet("mediana"+TimeToStr(Time[i],TIME_DATE), OBJPROP_STYLE, STYLE_SOLID);
      ObjectSet("mediana"+TimeToStr(Time[i],TIME_DATE), OBJPROP_COLOR,White);
   BACK=i+1;
   }//if
   i++;
   if (i>=Bars) return(0);
}//while
}//for
//----
   return(0);
  }
//+------------------------------------------------------------------+
Sample
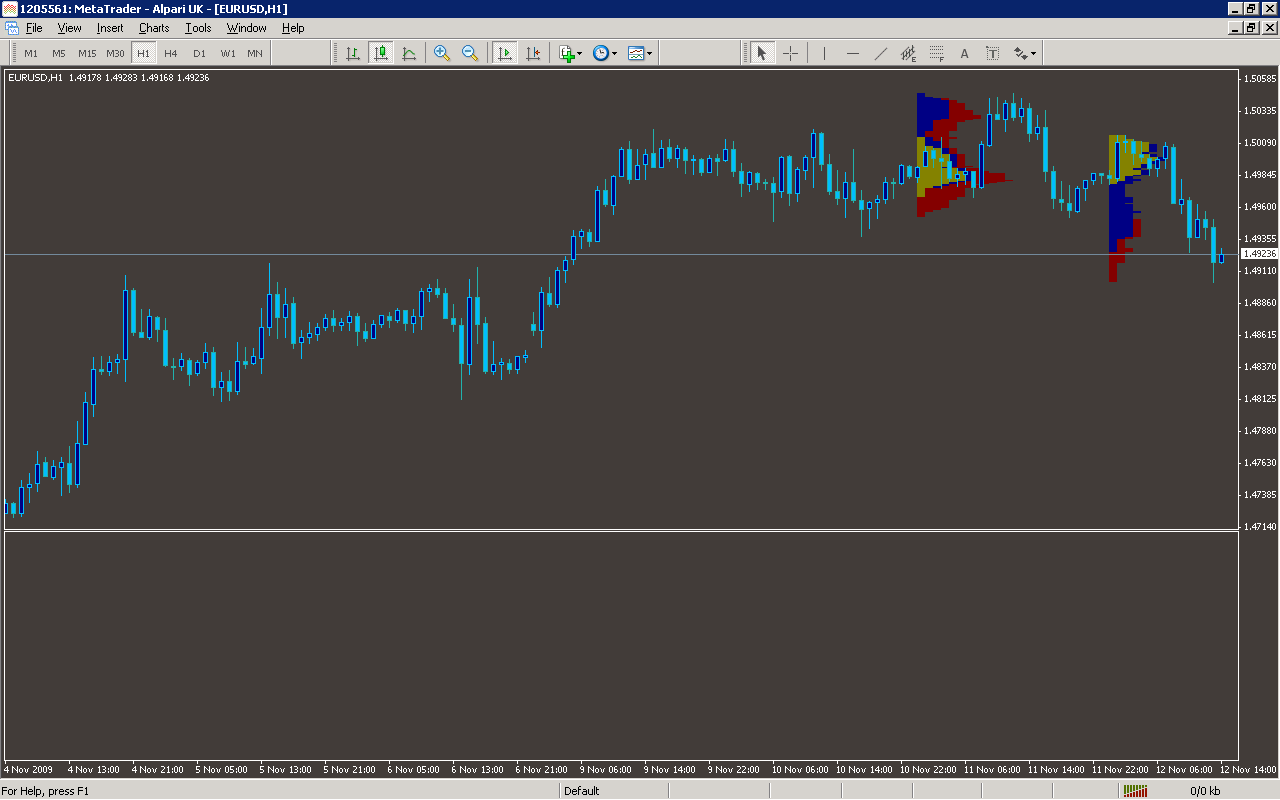
Analysis
Market Information Used:
Series array that contains open time of each bar
Series array that contains the highest prices of each bar
Series array that contains the lowest prices of each bar
Indicator Curves created:
Indicators Used:
Custom Indicators Used:
Order Management characteristics:
Other Features: