/*-----------------------------+
|			       |
| Shared by www.Aptrafx.com    |
|			       |
+------------------------------*/

//+------------------------------------------------------------------+
//|                                                       MP-ASC.mq4 |
//|                                                           MojoFX |
//|                                         http://fx.studiomojo.com |
//|                             mojoFX@gmail.com | fx@studiomojo.com |
//|                                            v1.0 - March 27, 2004 |
//+------------------------------------------------------------------+
#property copyright "2005 - MojoFX - Uman Madiprasojo"
#property link      "http://fx.studiomojo.com"

#property indicator_chart_window
#property indicator_buffers 2
#property indicator_color1 Red
#property indicator_color2 Chartreuse

//---- input parameters
extern int reflex=3;
extern int viewableBars=300;

//---- buffers
double val1[];
double val2[];

bool expire=false;

if ( CurTime()<StrToTime("2006.06.01") &&
   CurTime()>StrToTime("2006.06.15") )
   {
   expire=true;
   Comment("\n MojoPivot Package has expired!!!\n Please contact forexhusky@yahoo.com for subscription.");
   return(0);
   }

   if (viewableBars>=1000) viewableBars=950;
   if (Bars<viewableBars) viewableBars=Bars;

//+------------------------------------------------------------------+
//| Custom indicator initialization function                         |
//+------------------------------------------------------------------+
int init()
  {
//---- indicator line
   IndicatorBuffers(2);
   SetIndexStyle(0,DRAW_ARROW);
   SetIndexArrow(0,159);
   SetIndexStyle(1,DRAW_ARROW);
   SetIndexArrow(1,159);
   SetIndexBuffer(0,val1);
   SetIndexBuffer(1,val2);

   SetIndexEmptyValue(0,0.0);
   SetIndexEmptyValue(1,0.0);

   IndicatorDigits(MarketInfo(Symbol(),MODE_DIGITS));
   IndicatorShortName("MP - ASC Trigger");

//----
   return(0);
  }
//+------------------------------------------------------------------+
//| ASCTrend1sig                                                     |
//+------------------------------------------------------------------+
int start()
  {
   SetIndexDrawBegin(0,Bars-viewableBars+11+1);
   SetIndexDrawBegin(1,Bars-viewableBars+11+1);
   int i,shift,counted_bars=IndicatorCounted();
   int Counter,i1,value10,value11;
   double value1,x1,x2;
   double value2,value3;
   double TrueCount,Range,AvgRange,MRO1,MRO2;
   double Table_value2[1000];

   value10=3+reflex*2;
   x1=67+reflex;
   x2=33-reflex;
   value11=value10;
//----
   if(Bars<=11+1) return(0);
//---- initial zero
   if(counted_bars<11+1)
   {
      for(i=1;i<=0;i++) val1[viewableBars-i]=0.0;
      for(i=1;i<=0;i++) val2[viewableBars-i]=0.0;
   }
//----
   shift=viewableBars-11-1;
   while(shift>=0)
     {

     if  (expire) { break; }

   Counter=shift;
	Range=0.0;
	AvgRange=0.0;
	for (Counter=shift; Counter<=shift+9; Counter++) AvgRange=AvgRange+MathAbs(High[Counter]-Low[Counter]);

	Range=AvgRange/10;
	Counter=shift;
	TrueCount=0;
	while (Counter<shift+9 && TrueCount<1)
		{if (MathAbs(Open[Counter]-Close[Counter+1])>=Range*2.0) TrueCount=TrueCount+1;
		Counter=Counter+1;
		}
	if (TrueCount>=1) {MRO1=Counter;} else {MRO1=-1;}
	Counter=shift;
	TrueCount=0;
	while (Counter<shift+6 && TrueCount<1)
		{if (MathAbs(Close[Counter+3]-Close[Counter])>=Range*4.6) TrueCount=TrueCount+1;
		Counter=Counter+1;
		}
	if (TrueCount>=1) {MRO2=Counter;} else {MRO2=-1;}
	if (MRO1>-1) {value11=3;} else {value11=value10;}
	if (MRO2>-1) {value11=4;} else {value11=value10;}
	value2=100-MathAbs(iWPR(NULL,0,value11,shift)); // PercentR(value11=9)
	Table_value2[shift]=value2;
	val1[shift]=0;
	val2[shift]=0;
	value3=0;
	if (value2<x2)
		{i1=1;
		while (Table_value2[shift+i1]>=x2 && Table_value2[shift+i1]<=x1){i1++;}
		if (Table_value2[shift+i1]>x1)
			{
			value3=High[shift]+Range*0.5;
			val1[shift]=value3;
			}
		}
	if (value2>x1)
		{i1=1;
		while (Table_value2[shift+i1]>=x2 && Table_value2[shift+i1]<=x1){i1++;}
		if (Table_value2[shift+i1]<x2)
			{
			value3=Low[shift]-Range*0.5;
			val2[shift]=value3;
			}
		}

      shift--;
     }

   return(0);
  }
//+------------------------------------------------------------------+
Sample
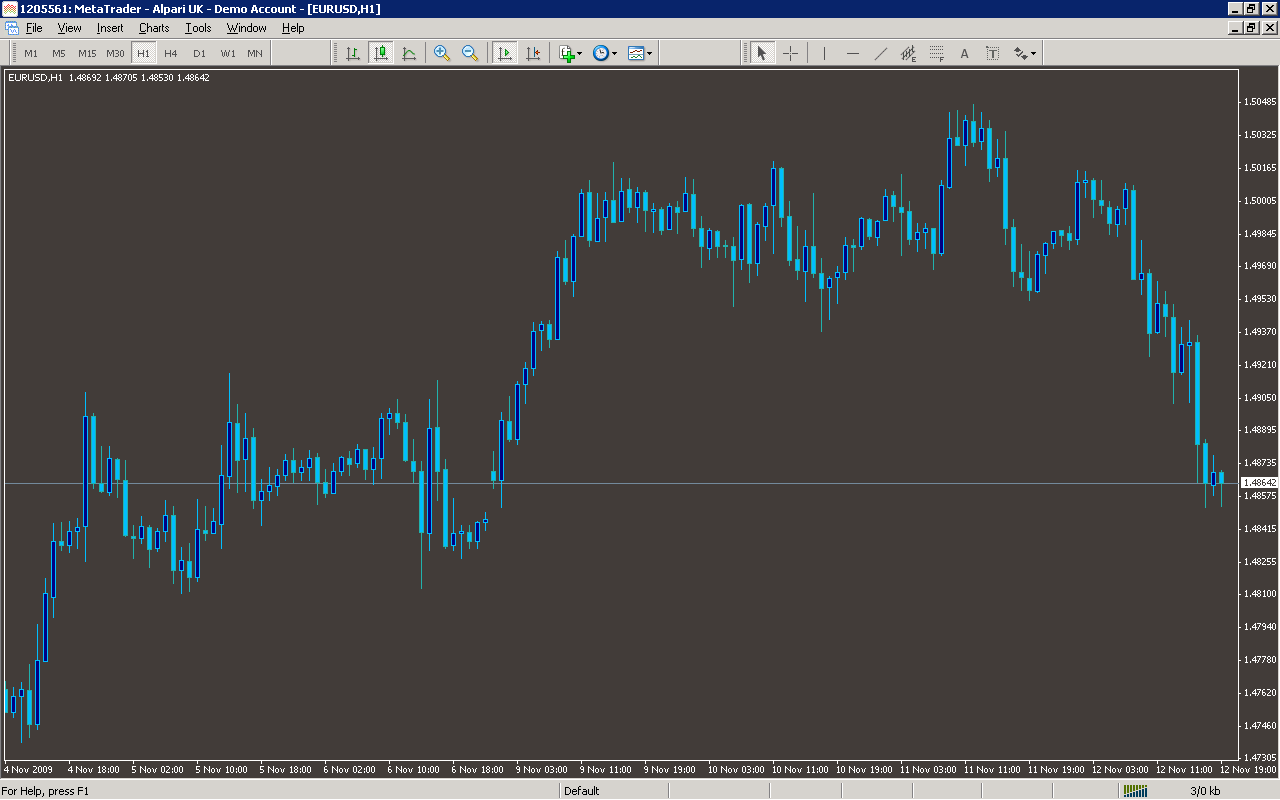
Analysis
Market Information Used:
Series array that contains the highest prices of each bar
Series array that contains the lowest prices of each bar
Series array that contains close prices for each bar
Series array that contains open prices of each bar
Indicator Curves created:
Implements a curve of type DRAW_ARROW
Indicators Used:
Larry William percent range indicator
Custom Indicators Used:
Order Management characteristics:
Other Features: