/*-----------------------------+
|			       |
| Shared by www.Aptrafx.com    |
|			       |
+------------------------------*/

//+------------------------------------------------------------------+
//|                                     past regression deviated.mq4 |
//|                Copyright © 2006, tageiger, aka fxid10t@yahoo.com |
//|                                        http://www.metaquotes.net |
//+------------------------------------------------------------------+
#property copyright "Copyright © 2006, tageiger, aka fxid10t@yahoo.com"
#property link      "http://www.metaquotes.net"

#property indicator_chart_window
#property indicator_buffers 7
#property indicator_color1 Yellow
#property indicator_color2 Olive
#property indicator_color3 Olive
#property indicator_color4 Orange
#property indicator_color5 Orange
#property indicator_color6 Gray
#property indicator_color7 Gray
//---- input parameters

int period=0;
/*default 0 means the channel will use the open time from "x" bars back on which ever time period
the indicator is attached to.  one can change to 1,5,15,30,60...etc to "lock" the start time to a specific
period, and then view the "locked" channels on a different time period...*/

extern int LR.length=55;   // bars back regression begins
extern double std.channel.1=1;        // 1st channel
extern double std.channel.2=2;        // 2nd channel
extern double std.channel.3=3;        // 3nd channel
//---- indicator buffers
double mean.Buffer[];
double high.1.Buffer[];
double low.1.Buffer[];
double high.2.Buffer[];
double low.2.Buffer[];
double high.3.Buffer[];
double low.3.Buffer[];

int init()  {
/*---- line shifts when drawing
   SetIndexShift(0,JawsShift);
   SetIndexShift(1,TeethShift);
   SetIndexShift(2,LipsShift);
//---- first positions skipped when drawing*/
   SetIndexDrawBegin(0,LR.length);
   SetIndexDrawBegin(1,LR.length);
   SetIndexDrawBegin(2,LR.length);
   SetIndexDrawBegin(3,LR.length);
   SetIndexDrawBegin(4,LR.length);
   SetIndexDrawBegin(5,LR.length);
   SetIndexDrawBegin(6,LR.length);
//---- 3 indicator buffers mapping
   SetIndexBuffer(0,mean.Buffer);
   SetIndexBuffer(1,high.1.Buffer);
   SetIndexBuffer(2,low.1.Buffer);
   SetIndexBuffer(3,high.2.Buffer);
   SetIndexBuffer(4,low.2.Buffer);
   SetIndexBuffer(5,high.3.Buffer);
   SetIndexBuffer(6,low.3.Buffer);
//---- drawing settings
   SetIndexStyle(0,DRAW_LINE,0); SetIndexArrow(0,158);
   SetIndexStyle(1,DRAW_LINE,0); SetIndexArrow(1,158);
   SetIndexStyle(2,DRAW_LINE,0); SetIndexArrow(2,158);
   SetIndexStyle(3,DRAW_LINE,0); SetIndexArrow(3,158);
   SetIndexStyle(4,DRAW_LINE,0); SetIndexArrow(4,158);
   SetIndexStyle(5,DRAW_LINE,0); SetIndexArrow(5,158);
   SetIndexStyle(6,DRAW_LINE,0); SetIndexArrow(6,158);
//---- index labels
   SetIndexLabel(0,"mean");
   SetIndexLabel(1,"1st Std up");
   SetIndexLabel(2,"1st Std down");
   SetIndexLabel(3,"2nd Std up");
   SetIndexLabel(4,"2nd Std down");
   SetIndexLabel(5,"3rd Std up");
   SetIndexLabel(6,"3rd Std down");
//---- initialization done
return(0);}
int deinit() {ObjectsDeleteAll(0,OBJ_ARROW);ObjectDelete(period+"m "+LR.length+" TL");}
int start() {
   ObjectDelete(period+"m "+LR.length+" TL");
   int limit;
   int counted_bars=IndicatorCounted();
   if(counted_bars<0) return(-1);
   if(counted_bars>0) counted_bars--;
   limit=Bars-counted_bars;
//---- main loop
   for(int i=0; i<limit; i++) {
//linear regression calculation
      int start.bar=i+LR.length, end.bar=i;
      int n=start.bar-end.bar+1;
//---- calculate price values.. Linear regression calculation
      double value=Close[end.bar];
      double a,b,c;
      double sumy=value;
      double sumx=0.0;
      double sumxy=0.0;
      double sumx2=0.0;
      for(int ii=1; ii<n; ii++)  {
         value=Close[end.bar+ii];
         sumy+=value;
         sumxy+=value*ii;
         sumx+=ii;
         sumx2+=ii*ii; }
      c=sumx2*n-sumx*sumx;
      if(c==0.0) return;
      b=(sumxy*n-sumx*sumy)/c;
      a=(sumy-sumx*b)/n;
      double LR.price.2=a;
      double LR.price.1=a+b*n;
      mean.Buffer[i]=NormalizeDouble(LR.price.2,Digits);
/*---- maximal deviation calculation (3rd deviation line)
      double max.dev=0;
      double deviation=0;
      double dvalue=a;
      for(int i.1=0; i.1<n; i.1++)   {
         value=Close[end.bar+i.1];
         dvalue+=b;
         deviation=MathAbs(value-dvalue);
         if(max.dev<=deviation) max.dev=deviation; } */
//Linear regression trendline
      ObjectDelete(period+"m "+LR.length+" TL");
      ObjectCreate(period+"m "+LR.length+" TL",OBJ_TREND,0,Time[start.bar],LR.price.1,Time[end.bar],LR.price.2);
      ObjectSet(period+"m "+LR.length+" TL",OBJPROP_COLOR,Orange);
      ObjectSet(period+"m "+LR.length+" TL",OBJPROP_WIDTH,2);
      ObjectSet(period+"m "+LR.length+" TL",OBJPROP_RAY,false);
//...standard deviation...
      double x=0,x.sum=0,x.avg=0,x.sum.squared=0,std.dev=0;
      for(int iii=i; iii<start.bar; iii++)    {
         x=MathAbs(Close[iii]-ObjectGetValueByShift(period+"m "+LR.length+" TL",iii));
         x.sum.squared+=(x*x);   }
         std.dev=MathSqrt(x.sum.squared/((start.bar-end.bar)-1));
      //Print("LR.price.1 ",LR.price.1,"  LR.Price.2 ",LR.price.2," std.dev ",std.dev);

//...standard deviation channels...
high.1.Buffer[i]=mean.Buffer[i]+(std.channel.1*std.dev);
low.1.Buffer[i]=mean.Buffer[i]-(std.channel.1*std.dev);
high.2.Buffer[i]=mean.Buffer[i]+(std.channel.2*std.dev);
low.2.Buffer[i]=mean.Buffer[i]-(std.channel.2*std.dev);
high.3.Buffer[i]=mean.Buffer[i]+(std.channel.3*std.dev);//max.dev;
low.3.Buffer[i]=mean.Buffer[i]-(std.channel.3*std.dev);//max.dev;
}
return(0);}
//+------------------------------------------------------------------+
Sample
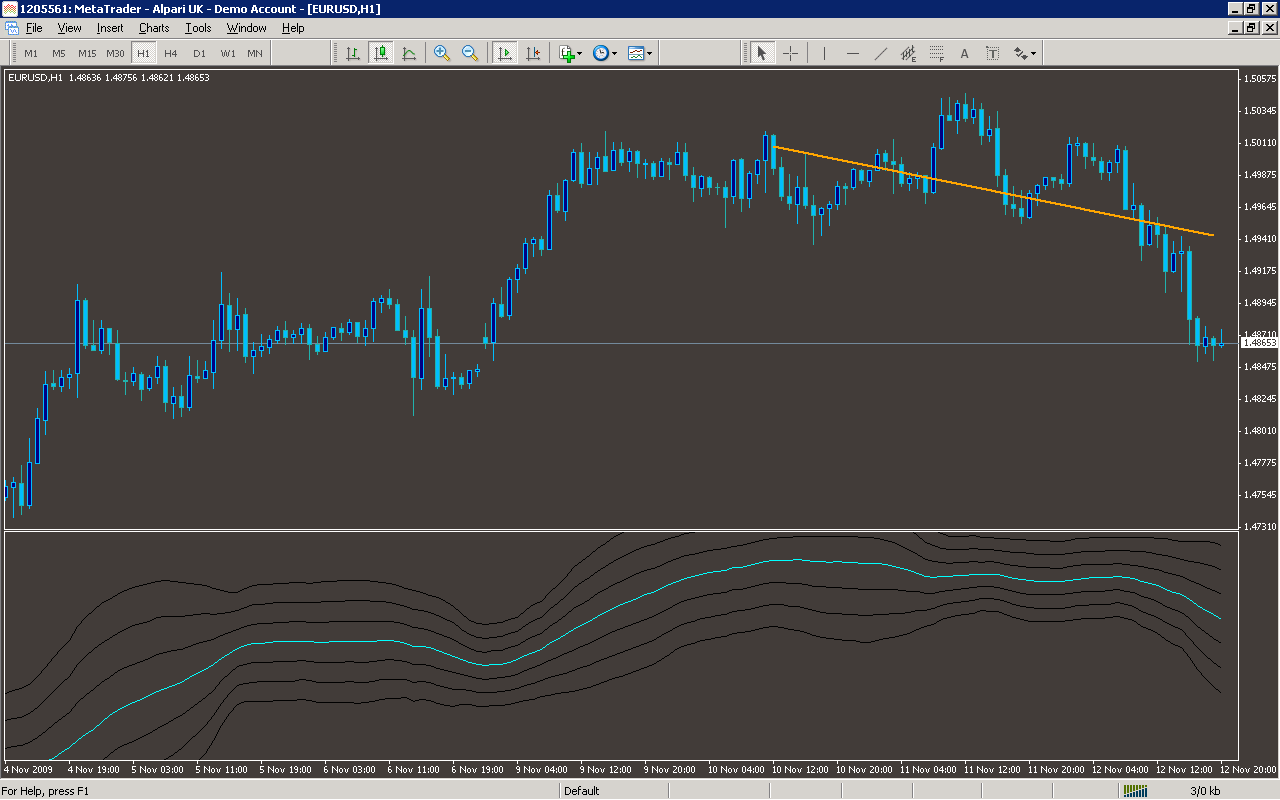
Analysis
Market Information Used:
Series array that contains close prices for each bar
Series array that contains open time of each bar
Indicator Curves created:
Implements a curve of type DRAW_LINE
Indicators Used:
Custom Indicators Used:
Order Management characteristics:
Other Features: