//--------------------------------------------------------------------
// Pivot Points - Daily (Shifted).mq4
// Copyright © 2009, SwingTree Ltd
//
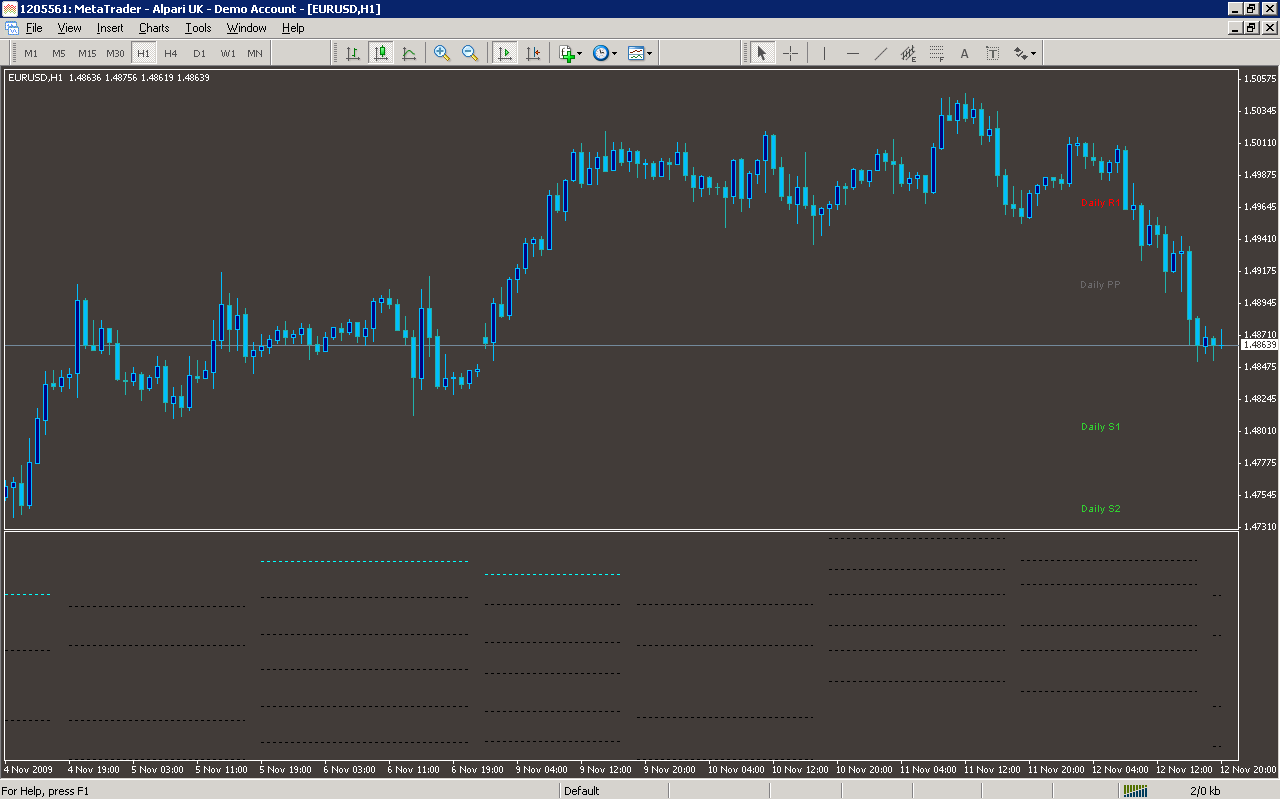
// This indicator plots horizontal lines at daily pivot levels R3, R2,
// R1, Pivot, S1, S2 & S3, using a day that is advanced (or retarded)
// from the server time (called Pivot Day).
//
// The only input is the integer "ShiftHrs", which gives the number of
// hours to advance the pivot day. A negative value delays the day for
// pivot calculation. For example, if your server is on New York time
// (GMT-5) and you want pivot points in London time (GMT), then
// ShiftHrs is set to +5 (the default in the code).
//
// Saturday and Sunday trading is not ignored (after all it was real
// trading). If the pivot day shift results in data appearing on
// Saturday, it was really Friday where it occured, so the indicator
// treats it as part of Friday. If the pivot day shift results in data
// appearing on Sunday, it was really Monday where it occured, so the
// indicator treats it as Monday.
//
// It uses an indicator buffer for each line, so pivot levels of
// previous days remain visible. (This has a negative consequence:
// it is not possible to use the same technique to draw intermediate
// levels (S0.5, S1.5, etc.) because of the limit of 8 buffers.)
//
// Labels are shown for the most recent day's levels.
//
// This indicator can be applied to any chart period, although daily
// pivots on charts with long periods are meaningless.
//
// 2009.07.02
// There was an error in the calculation of R3 & S3,
// which is now corrected.
//
//--------------------------------------------------------------------
#property copyright "Copyright © 2009, SwingTree Ltd"
#define R3_NAME "Daily R3"
#define R2_NAME "Daily R2"
#define R1_NAME "Daily R1"
#define PIVOT_NAME "Daily PP"
#define S1_NAME "Daily S1"
#define S2_NAME "Daily S2"
#define S3_NAME "Daily S3"
#define FONT "Arial"
#define R3_COL Red
#define R2_COL Red
#define R1_COL Red
#define PIVOT_COL DimGray
#define S1_COL LimeGreen
#define S2_COL LimeGreen
#define S3_COL LimeGreen
#property indicator_chart_window
#property indicator_buffers 7
#property indicator_color1 R3_COL
#property indicator_color2 R2_COL
#property indicator_color3 R1_COL
#property indicator_color4 PIVOT_COL
#property indicator_color5 S1_COL
#property indicator_color6 S2_COL
#property indicator_color7 S3_COL
// Input(s)
extern int ShiftHrs = 5; // Pivot day shift
// positive value moves pivot day earlier
// Buffers for levels
double Res3[], Res2[], Res1[], Pivot[], Sup1[], Sup2[], Sup3[];
double PDayHigh, PDayLow;
string ThisSymbol;
datetime BarTime, PivotDayStartTime;
int VisibleBars, DayStartBar, LeftMostBar, RightMostBar;
//--------------------------------------------------------------------
// Initialization
//--------------------------------------------------------------------
int init()
{
// Attach indicator arrays to buffers
SetIndexBuffer( 0, Res3);
SetIndexBuffer( 1, Res2);
SetIndexBuffer( 2, Res1);
SetIndexBuffer( 3, Pivot);
SetIndexBuffer( 4, Sup1);
SetIndexBuffer( 5, Sup2);
SetIndexBuffer( 6, Sup3);
// Set styles
SetIndexStyle( 0, DRAW_LINE, STYLE_DOT, 1);
SetIndexStyle( 1, DRAW_LINE, STYLE_DOT, 1);
SetIndexStyle( 2, DRAW_LINE, STYLE_DOT, 1);
SetIndexStyle( 3, DRAW_LINE, STYLE_DOT, 1);
SetIndexStyle( 4, DRAW_LINE, STYLE_DOT, 1);
SetIndexStyle( 5, DRAW_LINE, STYLE_DOT, 1);
SetIndexStyle( 6, DRAW_LINE, STYLE_DOT, 1);
// Set empty values
SetIndexEmptyValue( 0, EMPTY_VALUE );
SetIndexEmptyValue( 1, EMPTY_VALUE );
SetIndexEmptyValue( 2, EMPTY_VALUE );
SetIndexEmptyValue( 3, EMPTY_VALUE );
SetIndexEmptyValue( 4, EMPTY_VALUE );
SetIndexEmptyValue( 5, EMPTY_VALUE );
SetIndexEmptyValue( 6, EMPTY_VALUE );
// Set labels
SetIndexLabel( 0, R3_NAME );
SetIndexLabel( 1, R2_NAME );
SetIndexLabel( 2, R1_NAME );
SetIndexLabel( 3, PIVOT_NAME );
SetIndexLabel( 4, S1_NAME );
SetIndexLabel( 5, S2_NAME );
SetIndexLabel( 6, S3_NAME );
// Put text on the chart
ObjectCreate( R3_NAME, OBJ_TEXT, 0, 0, 0 );
ObjectCreate( R2_NAME, OBJ_TEXT, 0, 0, 0 );
ObjectCreate( R1_NAME, OBJ_TEXT, 0, 0, 0 );
ObjectCreate( PIVOT_NAME, OBJ_TEXT, 0, 0, 0 );
ObjectCreate( S1_NAME, OBJ_TEXT, 0, 0, 0 );
ObjectCreate( S2_NAME, OBJ_TEXT, 0, 0, 0 );
ObjectCreate( S3_NAME, OBJ_TEXT, 0, 0, 0 );
// Set the text characteristics
ObjectSetText( R3_NAME, R3_NAME, 8, FONT, R3_COL );
ObjectSetText( R2_NAME, R2_NAME, 8, FONT, R2_COL );
ObjectSetText( R1_NAME, R1_NAME, 8, FONT, R1_COL );
ObjectSetText( PIVOT_NAME, PIVOT_NAME, 8, FONT, PIVOT_COL );
ObjectSetText( S1_NAME, S1_NAME, 8, FONT, S1_COL );
ObjectSetText( S2_NAME, S2_NAME, 8, FONT, S2_COL );
ObjectSetText( S3_NAME, S3_NAME, 8, FONT, S3_COL );
// Catch bad input
if( MathAbs( ShiftHrs ) > 23 )
{
Alert( "ShiftHrs is too large. Reset to 0 hrs. ");
ShiftHrs = 0;
}
ThisSymbol = Symbol();
PivotDayStartTime = Time[Bars-1]; // the first bar
return(0);
}
//--------------------------------------------------------------------
//| De-initialization |
//--------------------------------------------------------------------
int deinit()
{
// Remove texts
ObjectDelete( R3_NAME );
ObjectDelete( R2_NAME );
ObjectDelete( R1_NAME );
ObjectDelete( PIVOT_NAME );
ObjectDelete( S1_NAME );
ObjectDelete( S2_NAME );
ObjectDelete( S3_NAME );
return(0);
}
//--------------------------------------------------------------------
//| Main iteration |
//--------------------------------------------------------------------
int start()
{
int i, Count;
double Range;
i = Bars - IndicatorCounted() - 1;
while(i >= 0)
{
// If the pivot day changes...
if( PivotDay( Time[i+1], ShiftHrs ) != PivotDay( Time[i], ShiftHrs ) )
{
// Determine High & Low for the previous Pivot Day
Count = iBarShift( NULL, 0, PivotDayStartTime ) - i; // number of bars in the day
PDayHigh = High[ iHighest( NULL, 0, MODE_HIGH, Count, i+1 ) ]; // Pivot Day high
PDayLow = Low[ iLowest( NULL, 0, MODE_LOW, Count, i+1 ) ]; // Pivot Day low
// Pivot calculations
Pivot[i] = ( PDayHigh + PDayLow + Close[i+1] ) / 3; // Pivot point
Range = PDayHigh - PDayLow;
Res1[i] = 2 * Pivot[i] - PDayLow; // R1
Res2[i] = Pivot[i] + Range; // R2
Res3[i] = Res1[i] + Range; // R3
Sup1[i] = 2 * Pivot[i] - PDayHigh; // S1
Sup2[i] = Pivot[i] - Range; // S2
Sup3[i] = Sup1[i] - Range; // S3
// Don't draw the transition between levels
Res3[i+1] = EMPTY_VALUE;
Res2[i+1] = EMPTY_VALUE;
Res1[i+1] = EMPTY_VALUE;
Pivot[i+1] = EMPTY_VALUE;
Sup1[i+1] = EMPTY_VALUE;
Sup2[i+1] = EMPTY_VALUE;
Sup3[i+1] = EMPTY_VALUE;
// Remember when the Day changed over
PivotDayStartTime = Time[i];
}
else // no change to pivot levels
{
Res3[i] = Res3[i+1];
Res2[i] = Res2[i+1];
Res1[i] = Res1[i+1];
Pivot[i] = Pivot[i+1];
Sup1[i] = Sup1[i+1];
Sup2[i] = Sup2[i+1];
Sup3[i] = Sup3[i+1];
}
// Move the labels to sensible places
// If this is the last bar and (it's a new bar or time scale has changed)...
if( i == 0 && ( BarTime != Time[i] || VisibleBars != WindowBarsPerChart() ) )
{
DayStartBar = iBarShift( ThisSymbol, Period(), PivotDayStartTime );
LeftMostBar = WindowFirstVisibleBar()-7;
RightMostBar = 15;
if( DayStartBar < RightMostBar ) // label too close to the right
{
ObjectMove( R3_NAME, 0, Time[RightMostBar], Res3[i] );
ObjectMove( R2_NAME, 0, Time[RightMostBar], Res2[i] );
ObjectMove( R1_NAME, 0, Time[RightMostBar], Res1[i] );
ObjectMove( PIVOT_NAME, 0, Time[RightMostBar], Pivot[i] );
ObjectMove( S1_NAME, 0, Time[RightMostBar], Sup1[i] );
ObjectMove( S2_NAME, 0, Time[RightMostBar], Sup2[i] );
ObjectMove( S3_NAME, 0, Time[RightMostBar], Sup3[i] );
}
else if ( DayStartBar > LeftMostBar ) // label too close to the left
{
ObjectMove( R3_NAME, 0, Time[LeftMostBar], Res3[i] );
ObjectMove( R2_NAME, 0, Time[LeftMostBar], Res2[i] );
ObjectMove( R1_NAME, 0, Time[LeftMostBar], Res1[i] );
ObjectMove( PIVOT_NAME, 0, Time[LeftMostBar], Pivot[i] );
ObjectMove( S1_NAME, 0, Time[LeftMostBar], Sup1[i] );
ObjectMove( S2_NAME, 0, Time[LeftMostBar], Sup2[i] );
ObjectMove( S3_NAME, 0, Time[LeftMostBar], Sup3[i] );
}
else // move it with the bars
{
ObjectMove( R3_NAME, 0, PivotDayStartTime, Res3[i] );
ObjectMove( R2_NAME, 0, PivotDayStartTime, Res2[i] );
ObjectMove( R1_NAME, 0, PivotDayStartTime, Res1[i] );
ObjectMove( PIVOT_NAME, 0, PivotDayStartTime, Pivot[i] );
ObjectMove( S1_NAME, 0, PivotDayStartTime, Sup1[i] );
ObjectMove( S2_NAME, 0, PivotDayStartTime, Sup2[i] );
ObjectMove( S3_NAME, 0, PivotDayStartTime, Sup3[i] );
}
}
VisibleBars = WindowBarsPerChart();
BarTime = Time[i];
i--;
}
return(0);
}
//--------------------------------------------------------------------
// int PivotDay( datetime BarTime, datetime ShiftHrs )
// Returns the day of the week for pivot point calculations.
// datetime BarTime: time stamp of the bar of interest
// datetime Shift: the pivot time - server time shift
// i.e. if the time for pivot calculation is ahead
// of server time, the shift is positive.
//--------------------------------------------------------------------
int PivotDay( datetime BarTime, datetime ShiftHrs )
{
int PDay = TimeDayOfWeek( BarTime + ShiftHrs * 3600 );
if( PDay == 0 ) PDay = 1; // Count Sunday as Monday
if( PDay == 6 ) PDay = 5; // Count Saturday as Friday
return( PDay );
}
Sample
Analysis
Market Information Used:
Series array that contains open time of each bar
Series array that contains the highest prices of each bar
Series array that contains the lowest prices of each bar
Series array that contains close prices for each bar
Indicator Curves created:
Implements a curve of type DRAW_LINE
Indicators Used:
Custom Indicators Used:
Order Management characteristics:
Other Features:
It issuies visual alerts to the screen