/*-----------------------------+
|			       |
| Shared by www.Aptrafx.com    |
|			       |
+------------------------------*/

//+------------------------------------------------------------------+
//|                                                  PredictPrice    |
//|                                    Copyright © 2006, Robert Hill |
//|                                                                  |
//| Attempts to pridict next price.                                  |
//| Based on formula provided by Bud Foxx
//+------------------------------------------------------------------+
#property  copyright "Copyright © 2006, Robert Hill "

//---- indicator settings
#property  indicator_separate_window
#property  indicator_buffers 3
#property indicator_color1 Yellow
#property indicator_color2 Red
#property indicator_color3 Green
#property indicator_width1 2
#property indicator_width2 2
#property indicator_width3 2

extern int BuyLevel = 80;
extern int SellLevel = 60;

//---- buffers
double UpBuffer[];
double DownBuffer[];
double FlatBuffer[];

//+------------------------------------------------------------------+
//| Custom indicator initialization function                         |
//+------------------------------------------------------------------+
int init()
  {

   SetIndexBuffer(2,UpBuffer);
   SetIndexBuffer(1,DownBuffer);
   SetIndexBuffer(0,FlatBuffer);

   SetIndexStyle(2,DRAW_HISTOGRAM,STYLE_SOLID,2);
   SetIndexStyle(1,DRAW_HISTOGRAM,STYLE_SOLID,2);
   SetIndexStyle(0,DRAW_HISTOGRAM,STYLE_SOLID,2);

//---- initialization done
   return(0);
  }

int start()

  {
   double D1, D2, D3, D4, D5;
   double DATA2, DATA5;
   double predict;
   int shift;
   int    limit;
   int    counted_bars=IndicatorCounted();
   if(counted_bars>0) counted_bars--;
   limit=Bars-counted_bars - 5;

   for(shift = limit; shift >= 0; shift--)
   {
         D1=iClose(NULL,0,shift+1);
         D2=iClose(NULL,0,shift+2);
         D3=iClose(NULL,0,shift+3);
         D4=iClose(NULL,0,shift+4);
         D5=iClose(NULL,0,shift+5);


         DATA2=(D1+D2) /2;
         DATA5=(D1+D2+ D3+D4+D5) /5;

         predict=((MathAbs( DATA2-DATA5) /D1*125.75 + 0.54528)*10000) /100;


//========== COLOR CODING ===========================================
/*
   IF PREDICT > 50 AND PREDICT < 60 THEN FLAT

   IF PREDICT > 80 AND DATA2>DATA5 THEN BUY

   IF PREDICT > 60 AND DATA2<DATA5 THEN SELL
*/

        UpBuffer[shift] = 0;
        DownBuffer[shift] = 0;
        FlatBuffer[shift] = 0;

        if (predict > BuyLevel && DATA2 > DATA5)
        {
            UpBuffer[shift] = predict;
        }
        else if (predict > SellLevel && DATA2 < DATA5)
        {
            DownBuffer[shift] = predict;
        }
        else
        {
            FlatBuffer[shift]=predict;
        }

      }

      return(0);
  }
//+------------------------------------------------------------------+
Sample
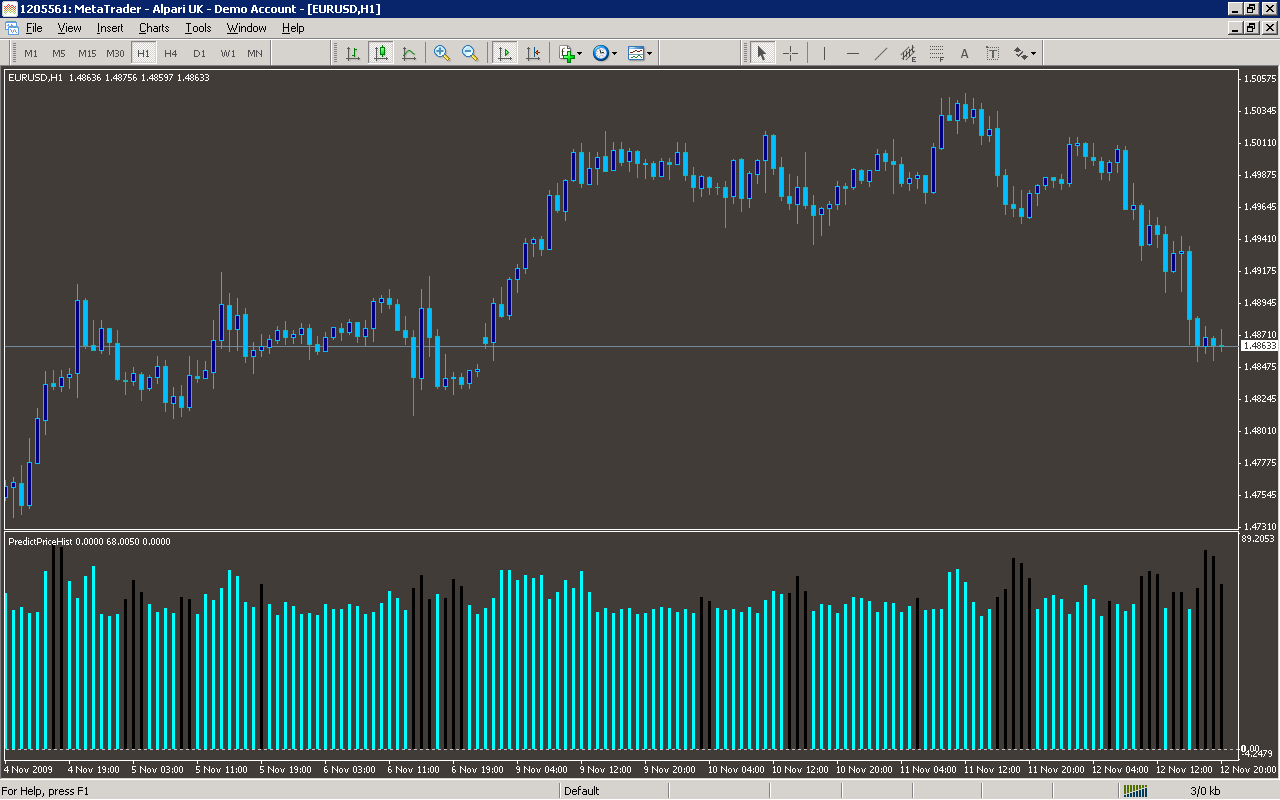
Analysis
Market Information Used:
Series array that contains close prices for each bar
Indicator Curves created:
Implements a curve of type DRAW_HISTOGRAM
Indicators Used:
Custom Indicators Used:
Order Management characteristics:
Other Features: