//+------------------------------------------------------------------+
//|                                                                  |
//|                                               Complex_pairs_T3   |
//|                                                                  |
//|                                                                  |
//+------------------------------------------------------------------+
#property copyright ""
#property link      ""

#property indicator_separate_window
#property indicator_buffers     3
#property indicator_color1      Magenta
#property indicator_width1      4
#property  indicator_color2     LimeGreen
#property indicator_width2      4
#property  indicator_color3     Red
#property indicator_width3      4
#property indicator_level1      0
#property indicator_levelstyle  STYLE_DOT
#property indicator_levelcolor  Yellow

//----
extern int    Periods       = 21;
extern int    T3_Period     = 5;
extern double b             = 0.618;
extern bool   Histogram     = false;
extern bool  DataDisplayOff = true;

//----
double e1, e2, e3, e4, e5, e6;
double c1, c2, c3, c4;
double n, w1, w2, b2, b3;
double cp[];
double cpup[];
double cpdn[];
//+------------------------------------------------------------------+
//| Custom indicator initialization function                         |
//+------------------------------------------------------------------+
int init()
  {
//---- indicators setting
    SetIndexBuffer(0, cp);
    SetIndexBuffer(1, cpup);
    SetIndexBuffer(2, cpdn);
//----
    SetIndexStyle(0, DRAW_LINE);
    SetIndexStyle(1, DRAW_HISTOGRAM);
    SetIndexStyle(2, DRAW_HISTOGRAM);
//----
    SetIndexLabel(0, "Complex_pairs_T3");
    SetIndexLabel(1, NULL);
    SetIndexLabel(2, NULL);
    if (DataDisplayOff)
    {
    SetIndexLabel(0,"");
    SetIndexLabel(1,"");
    SetIndexLabel(2,"");
    IndicatorShortName("");
    } else {
    IndicatorShortName("Complex_pairs_T3( " + T3_Period + ")");
    }
//---- variable reset
    b2 = b*b;
    b3 = b2*b;
    c1 = -b3;
    c2 = (3*(b2 + b3));
    c3 = -3*(2*b2 + b + b3);
    c4 = (1 + 3*b + b3 + 3*b2);
    n = T3_Period;
//----
    if(n < 1)
        n = 1;

   w1 = 2 / (2 + 0.5*(MathMax(1,n)-1));
   w2 = 1 - w1;
//----
    return(0);
  }
//+------------------------------------------------------------------+
//| Custom indicator iteration function                              |
//+------------------------------------------------------------------+
int start()
  {
   int limit;
   int counted_bars = IndicatorCounted();
//---- check for possible errors
   if(counted_bars < 0)
       return(-1);
//---- last counted bar will be recounted
   if(counted_bars > 0)
       counted_bars--;
   limit = Bars - counted_bars;
//---- indicator calculation
   for(int i = Bars - 1; i >= 0; i--)
     {
       cp[i] = iCustom(NULL,0,"Complex_pairs1",0,i);
       e1 = w1*cp[i] + w2*e1;
       e2 = w1*e1 + w2*e2;
       e3 = w1*e2 + w2*e3;
       e4 = w1*e3 + w2*e4;
       e5 = w1*e4 + w2*e5;
       e6 = w1*e5 + w2*e6;
       cp[i] = c1*e6 + c2*e5 + c3*e4 + c4*e3;
       //----
       if(Histogram == true)
       {
       if(cp[i] >= 0)
           cpup[i] = cp[i];
       else
           cpup[i] = 0;
       //----
       if(cp[i] < 0 )
           cpdn[i] = cp[i];
       else
           cpdn[i] = 0;
       }

     }
//----
   return(0);
  }
//+------------------------------------------------------------------+
Sample
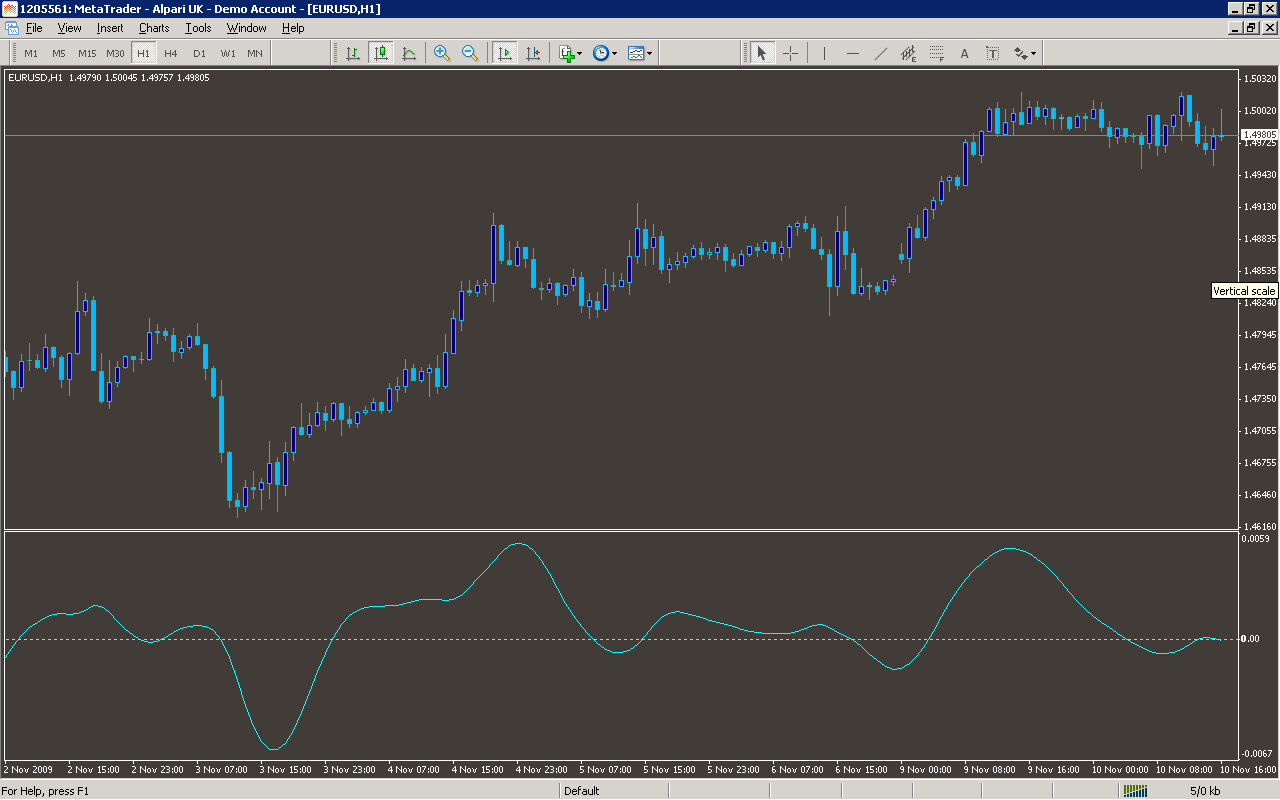
Analysis
Market Information Used:
Indicator Curves created:
Implements a curve of type DRAW_LINE
Implements a curve of type DRAW_HISTOGRAM
Indicators Used:
Custom Indicators Used:
Complex_pairs1
Order Management characteristics:
Other Features: