//+------------------------------------------------------------------+
//| prusax_v2.mq4                                                    |
//| 2008 modified by zIG                                             |
//+------------------------------------------------------------------+
#property indicator_chart_window
#property indicator_buffers 4
#property indicator_color1 White
#property indicator_color2 White
#property indicator_color3 Red
#property indicator_color4 Red
#property indicator_width1 2
#property indicator_width2 2
#property indicator_width3 2
#property indicator_width4 2
//---- buffers
double BufferUP[];
double BufferDN[];
double BufferUP1[];
double BufferDN1[];
//+------------------------------------------------------------------+
//| Custom indicator initialization function                         |
//+------------------------------------------------------------------+
int init()
  {
   string short_name;
//---- indicator line
   IndicatorBuffers(4);
   SetIndexStyle(0,DRAW_HISTOGRAM);
   SetIndexBuffer(0,BufferUP);
   SetIndexStyle(1,DRAW_HISTOGRAM);
   SetIndexBuffer(1,BufferUP1);
   SetIndexStyle(2,DRAW_HISTOGRAM);
   SetIndexBuffer(2,BufferDN);
   SetIndexStyle(3,DRAW_HISTOGRAM);
   SetIndexBuffer(3,BufferDN1);
   SetIndexDrawBegin(0,10);
   SetIndexDrawBegin(1,10);
   SetIndexDrawBegin(2,10);
   SetIndexDrawBegin(3,10);
//----
   return(0);
  }
//+------------------------------------------------------------------+
//|                                                                  |
//+------------------------------------------------------------------+
int start()
  {
   int i,counted_bars=IndicatorCounted();
   for(i=Bars-counted_bars-1;i>=0;i--)
     {
      if(i==0)
        {
         BufferUP[i]   =High[i];
         BufferUP1[i]  =(High[i]-(((High[i]-Open[i])+(Close[i]-Low[i]))/2));
         BufferDN[i]   =(High[i]-(((High[i]-Open[i])+(Close[i]-Low[i]))/2));
         BufferDN1[i]  =(High[i]-(((High[i]-Open[i])+(Close[i]-Low[i]))/2))-(((Open[i]-Low[i])+(High[i]-Close[i]))/2);
        }
      else
        {
         if(Close[i]>Open[i])
           {
            BufferUP[i]   =High[i];
            BufferUP1[i]  =Open[i];
            BufferDN[i]    =0.0;
            BufferDN1[i]   =0.0;
           }
         else
            if(Close[i]<Open[i])
              {
               BufferUP[i]   =0.0;
               BufferUP1[i]  =0.0;
               BufferDN[i]    =Open[i];
               BufferDN1[i]   =Low[i];
              }
        }
     }
//----
   return(0);
  }
//+------------------------------------------------------------------+
Sample
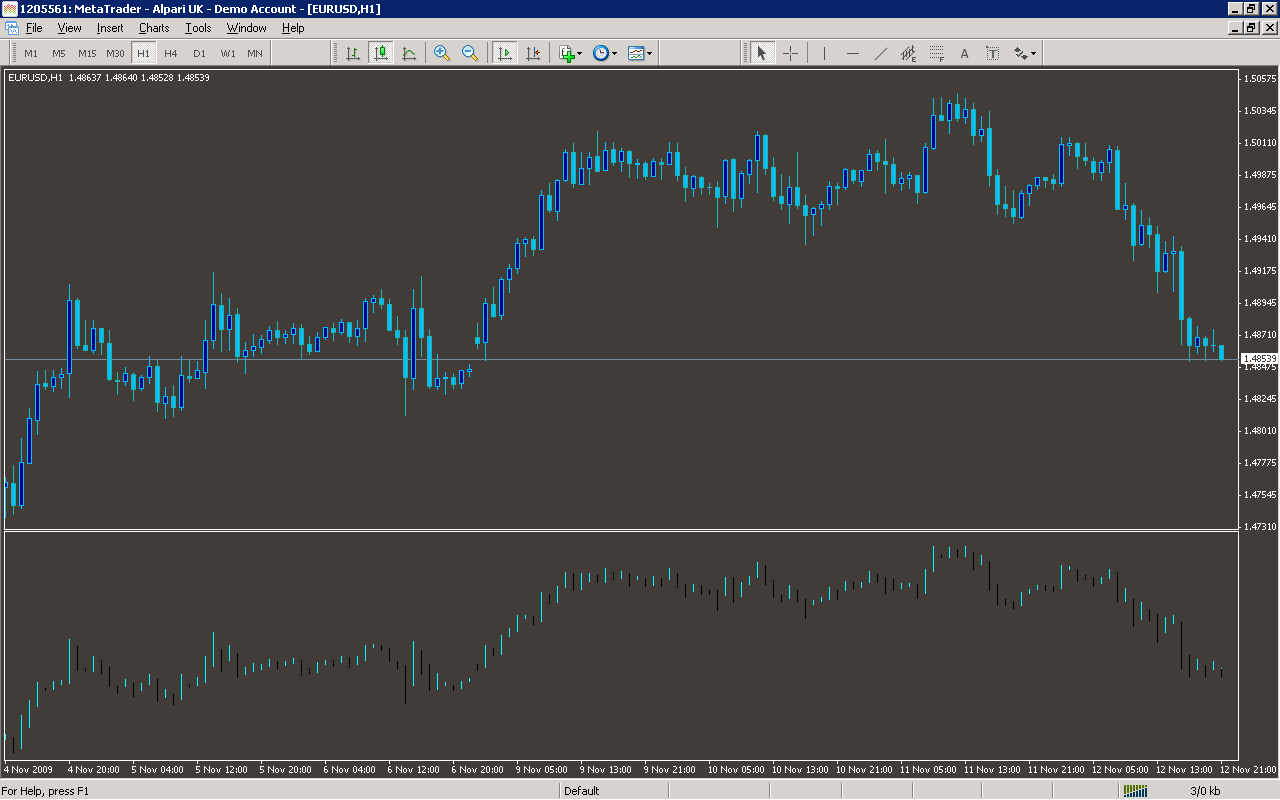
Analysis
Market Information Used:
Series array that contains the highest prices of each bar
Series array that contains close prices for each bar
Series array that contains the lowest prices of each bar
Series array that contains open prices of each bar
Indicator Curves created:
Implements a curve of type DRAW_HISTOGRAM
Indicators Used:
Custom Indicators Used:
Order Management characteristics:
Other Features: