//+------------------------------------------------------------------+
//| r-squared indicator
//| by Onur Sirek
//+------------------------------------------------------------------+
#property copyright "Onur Sirek"
#property link      "melihonurs@gmail.com"

#property indicator_separate_window
#property indicator_minimum 0
#property indicator_maximum 1
#property indicator_buffers 1
#property indicator_color1 Red
#property indicator_level1 0.2
#property indicator_level2 0.8

extern int    RSQPeriod=9;
double RSQBuffer[];

int init()
{
   string short_name;
   SetIndexStyle(0,DRAW_LINE);
   SetIndexBuffer(0,RSQBuffer);
   short_name="r-squared("+RSQPeriod+")";
   IndicatorShortName(short_name);
   SetIndexLabel(0,short_name);
   SetIndexDrawBegin(0,RSQPeriod);
   SetLevelValue(0,calcLevel(RSQPeriod));
   return(0);
}

int start()
{
   int i,k, start;
   int counted_bars=IndicatorCounted();

   if ((RSQPeriod<2) || (Bars<RSQPeriod)) return(0);
   start=Bars-RSQPeriod-1;
   if(counted_bars>RSQPeriod) start=Bars-counted_bars-1;

   for (i=start; i>=0; i--) {
      RSQBuffer[i] = RSquared(RSQPeriod,i);
   }

   return(0);
}

double calcLevel(double per)
{
   double per1,lev1, lenper, levdif;
   if (per<=5) return(0.77);
   if ((per>5) && (per<=10))  { per1=5;  lev1=0.77; lenper=5; levdif=0.37; }
   if ((per>10) && (per<=14)) { per1=10; lev1=0.40; lenper=4; levdif=0.13; }
   if ((per>14) && (per<=20)) { per1=14; lev1=0.27; lenper=6; levdif=0.07; }
   if ((per>20) && (per<=25)) { per1=20; lev1=0.20; lenper=5; levdif=0.04; }
   if ((per>25) && (per<=30)) { per1=25; lev1=0.16; lenper=5; levdif=0.03; }
   if ((per>30) && (per<=50)) { per1=30; lev1=0.13; lenper=20; levdif=0.05; }
   if ((per>50) && (per<=60)) { per1=50; lev1=0.08; lenper=10; levdif=0.02; }
   if ((per>60) && (per<=120)) { per1=60; lev1=0.06; lenper=60; levdif=0.03; }
   if (per>120) return(0.03);
   return(lev1 - (per-per1)*(levdif/lenper));
}

// r-squared shows the correlation with its linear regression line
// values close to 1.0 show perfect relation
// values close to 0.0 show poor relation
// See Metastock Help
// To determine if the trend is statistically significant for a given x-period linear regression line,
// plot the r-squared indicator and refer to the following table.  This table shows the values of
// r-squared required for a 95% confidence level at various time periods.  If the r-squared value
// is less than the critical values shown, you should assume that prices show no statistically
// significant trend.
// Number ofPeriods	r-squaredCritical Value(95%confidence)
//       5                 0.77
//       10                0.40
//       14	               0.27
//       20	               0.20
//       25	               0.16
//       30	               0.13
//       50	               0.08
//       60	               0.06
//       120               0.03
// You may even consider opening a short-term position opposite the prevailing trend when you
// observe r-squared rounding off at extreme levels.  For example, if the slope is positive and
// r-squared is above 0.80 and begins to turn down, you may consider selling or opening a short position.
// There are numerous ways to use the linear regression outputs of r-squared and Slope in trading
// systems.  For more detailed coverage, refer to the book The New Technical Trader by Tushar Chande
// and Stanley Kroll.
double RSquared(int per, int shift)
{
   int i;
   double x, y, div;
   double Ex=0.0, Ey=0.0, Exy=0.0, Ex2=0.0, Ey2=0.0;
   double Ex22, Ey22;
   double r;
   for (i=1; i<=per; i++) {
      x = i;               // x axis value
      y = Close[shift+i];  // y axis value
      Ex  += x;
      Ey  += y;
      Exy += x*y;
      Ex2 += MathPow(x,2);
      Ey2 += MathPow(y,2);
   }
   Ex22=MathPow(Ex,2);
   Ey22=MathPow(Ey,2);
   //slope = (per*Exy-Ex*Ey) / (per*Ex2-Ex22);  // slope of regression line
   //b = (Ey-slope*Ex)/per;
   div = MathSqrt((per*Ex2-Ex22)*(per*Ey2-Ey22));
   if (div==0) return(0);
   r = (per*Exy-Ex*Ey) / div;
   return(MathPow(r,2));
}
Sample
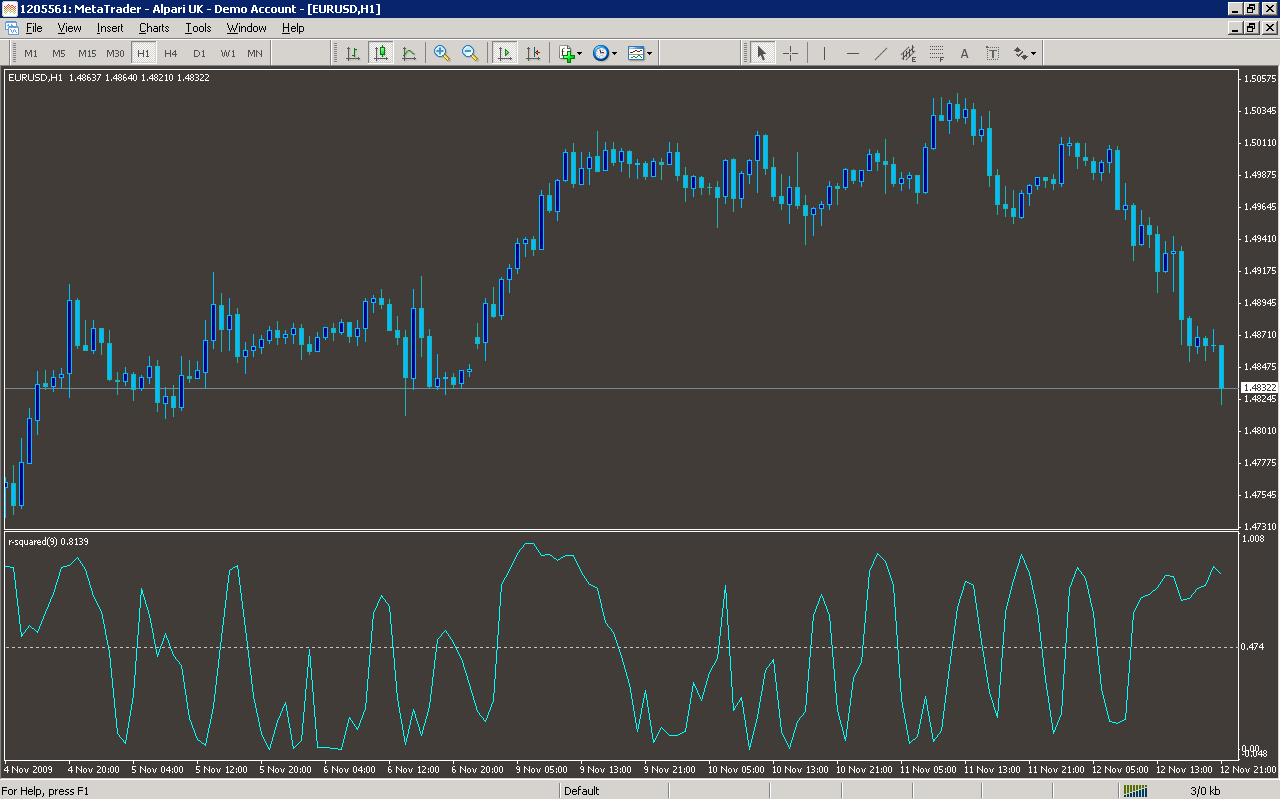
Analysis
Market Information Used:
Series array that contains close prices for each bar
Indicator Curves created:
Implements a curve of type DRAW_LINE
Indicators Used:
Custom Indicators Used:
Order Management characteristics:
Other Features: