/*-----------------------------+
|			       |
| Shared by www.Aptrafx.com    |
|			       |
+------------------------------*/

#property copyright "strategybuilderfx.com"
#property link "finger"
#property indicator_separate_window
#property indicator_buffers 3
#property indicator_color1 Green
#property indicator_color2 Yellow
#property indicator_color3 Red
//#property indicator_level1 70
//#property indicator_level2 30
//#property indicator_level3 46
//#property indicator_level4 54
//#property indicator_maximum 100
//#property indicator_minimum 0

//---- input parameters
extern int Len=14; //---- buffers
extern double UpperLevel = 70;
extern double LowerLevel = 30;
double rsxHigh[];
double rsxMid[];
double rsxLow[];

int init() {
//---- 1 additional buffer is used for counting.
   SetIndexBuffer(0,rsxHigh);
   SetIndexBuffer(1,rsxMid);
   SetIndexBuffer(2,rsxLow);
   SetIndexStyle(2,DRAW_LINE,STYLE_SOLID,2);
   SetIndexStyle(1,DRAW_LINE,STYLE_SOLID,2);
   SetIndexStyle(0,DRAW_LINE,STYLE_SOLID,2);
   IndicatorShortName("RSXinColor(" +Len+")");
   return(0);
}

int deinit()
{
   return(0);
}

int start()
{

   double f88, f90;
   double f0, v4, v8, vC, v10, v14, v18, v20;
   double f8, f10, f18, f20, f28, f30, f38, f48, v1C;
   double f50, f58, f60, f68, f70, f78, f80, f40;

   //int counted_bars = IndicatorCounted(),limit,shift;

   //if (counted_bars<0) return(-1);
   //if (counted_bars>0) counted_bars--;
   double limit=Bars-(Len)-1;

   //if(counted_bars>Len) limit=Bars-counted_bars-1;

   for (int shift=limit;shift>=0;shift--) {
      if (f90 == 0.0) {

         f90 = 1.0;
         f0 = 0.0;
         if (Len-1 >= 5) f88 = Len-1.0; else f88 = 5.0;
         f8 = 100.0*(Close[shift]);
         f18 = 3.0 / (Len + 2.0);
         f20 = 1.0 - f18;

      } else{
         if (f88 <= f90) f90 = f88 + 1; else f90 = f90 + 1;
         f10 = f8;
         f8 = 100*Close[shift];
         v8 = f8 - f10;
         f28 = f20 * f28 + f18 * v8;
         f30 = f18 * f28 + f20 * f30;
         vC = f28 * 1.5 - f30 * 0.5;
         f38 = f20 * f38 + f18 * vC;
         f40 = f18 * f38 + f20 * f40;
         v10 = f38 * 1.5 - f40 * 0.5;
         f48 = f20 * f48 + f18 * v10;
         f50 = f18 * f48 + f20 * f50;
         v14 = f48 * 1.5 - f50 * 0.5;
         f58 = f20 * f58 + f18 * MathAbs(v8);
         f60 = f18 * f58 + f20 * f60;
         v18 = f58 * 1.5 - f60 * 0.5;
         f68 = f20 * f68 + f18 * v18;

         f70 = f18 * f68 + f20 * f70;
         v1C = f68 * 1.5 - f70 * 0.5;
         f78 = f20 * f78 + f18 * v1C;
         f80 = f18 * f78 + f20 * f80;
         v20 = f78 * 1.5 - f80 * 0.5;

         if ((f88 >= f90) && (f8 != f10)) f0 = 1.0;
         if ((f88 == f90) && (f0 == 0.0)) f90 = 0.0;
      }

      if ((f88 < f90) && (v20 > 0.0000000001)) {

         v4 = (v14 / v20 + 1.0) * 50.0;
         if (v4 > 100.0) v4 = 100.0;
         if (v4 < 0.0) v4 = 0.0;

      } else {
         v4 = 50.0;
      }

      rsxHigh[shift]=v4;
      rsxMid[shift]=v4;
      rsxLow[shift]=v4;

      if (v4 >= UpperLevel)
      {
          rsxMid[shift] = EMPTY_VALUE;
          rsxLow[shift] = EMPTY_VALUE;
      }
      else if (v4 <= LowerLevel)
      {
          rsxHigh[shift] = EMPTY_VALUE;
          rsxMid[shift] = EMPTY_VALUE;
      }
      else
      {

         rsxHigh[shift]=EMPTY_VALUE;//EMPTY_VALUE;
         rsxLow[shift]=EMPTY_VALUE;//EMPTY_VALUE;
      }

   }

   return(0);

}
Sample
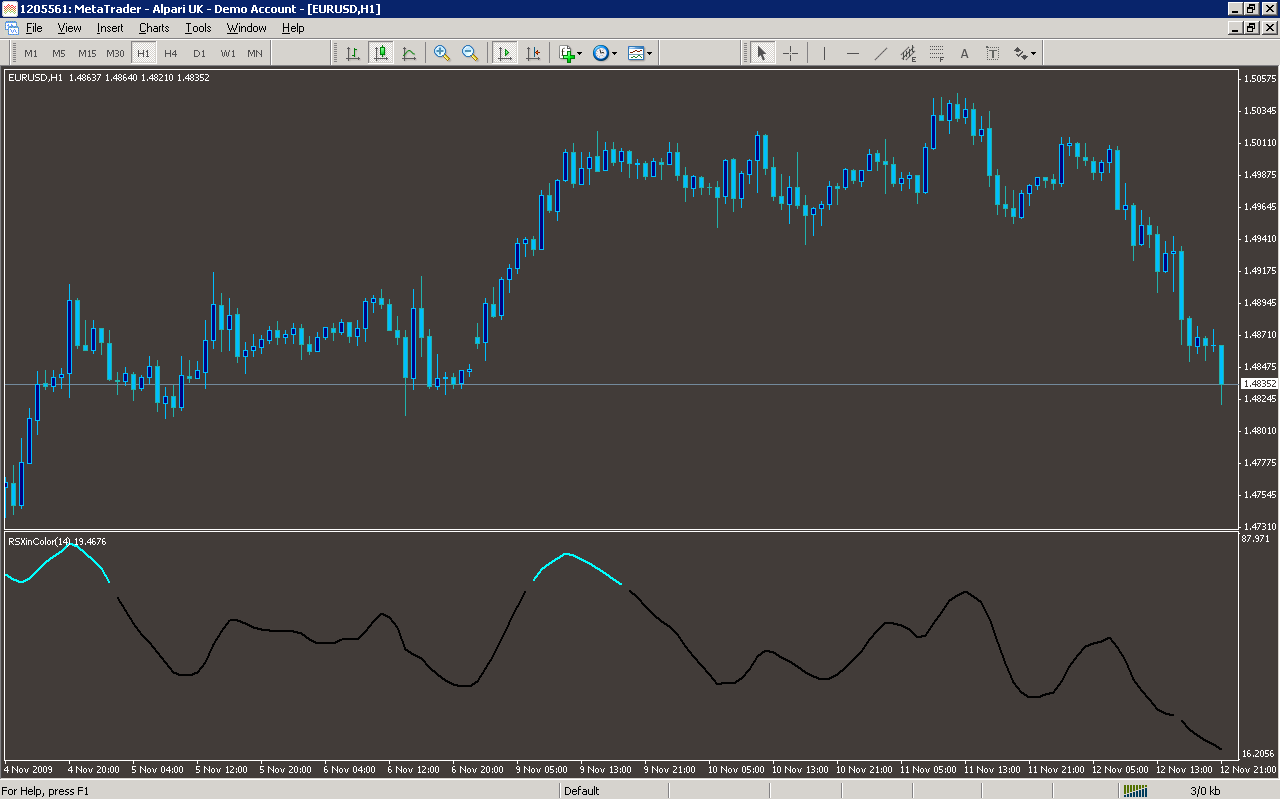
Analysis
Market Information Used:
Series array that contains the highest prices of each bar
Series array that contains the lowest prices of each bar
Series array that contains close prices for each bar
Indicator Curves created:
Implements a curve of type DRAW_LINE
Indicators Used:
Custom Indicators Used:
Order Management characteristics:
Other Features: