/*-----------------------------+
|			       |
| Shared by www.Aptrafx.com    |
|			       |
+------------------------------*/

#property copyright "strategybuilderfx.com"
#property link "finger"
#property indicator_separate_window
#property indicator_buffers 1
#property indicator_color1 Magenta
#property indicator_level1 70
#property indicator_level2 30
#property indicator_level3 50
#property indicator_maximum 100
#property indicator_minimum 0

//---- input parameters
extern int Len=14; //---- buffers
double rsx[];


int init() {
   SetIndexStyle(0,DRAW_LINE);
   SetIndexBuffer(0,rsx);
   IndicatorShortName("RSX");
   return(0);
}

int deinit()
{
   return(0);
}

int start()
{

   double f88, f90;
   double f0, v4, v8, vC, v10, v14, v18, v20;
   double f8, f10, f18, f20, f28, f30, f38, f48, v1C;
   double f50, f58, f60, f68, f70, f78, f80, f40;

   //int counted_bars = IndicatorCounted(),limit,shift;

   //if (counted_bars<0) return(-1);
   //if (counted_bars>0) counted_bars--;
   double limit=Bars-(Len)-1;

   //if(counted_bars>Len) limit=Bars-counted_bars-1;

   for (int shift=limit;shift>=0;shift--) {
      if (f90 == 0.0) {

         f90 = 1.0;
         f0 = 0.0;
         if (Len-1 >= 5) f88 = Len-1.0; else f88 = 5.0;
         f8 = 100.0*(Close[shift]);
         f18 = 3.0 / (Len + 2.0);
         f20 = 1.0 - f18;

      } else{
         if (f88 <= f90) f90 = f88 + 1; else f90 = f90 + 1;
         f10 = f8;
         f8 = 100*Close[shift];
         v8 = f8 - f10;
         f28 = f20 * f28 + f18 * v8;
         f30 = f18 * f28 + f20 * f30;
         vC = f28 * 1.5 - f30 * 0.5;
         f38 = f20 * f38 + f18 * vC;
         f40 = f18 * f38 + f20 * f40;
         v10 = f38 * 1.5 - f40 * 0.5;
         f48 = f20 * f48 + f18 * v10;
         f50 = f18 * f48 + f20 * f50;
         v14 = f48 * 1.5 - f50 * 0.5;
         f58 = f20 * f58 + f18 * MathAbs(v8);
         f60 = f18 * f58 + f20 * f60;
         v18 = f58 * 1.5 - f60 * 0.5;
         f68 = f20 * f68 + f18 * v18;

         f70 = f18 * f68 + f20 * f70;
         v1C = f68 * 1.5 - f70 * 0.5;
         f78 = f20 * f78 + f18 * v1C;
         f80 = f18 * f78 + f20 * f80;
         v20 = f78 * 1.5 - f80 * 0.5;

         if ((f88 >= f90) && (f8 != f10)) f0 = 1.0;
         if ((f88 == f90) && (f0 == 0.0)) f90 = 0.0;
      }

      if ((f88 < f90) && (v20 > 0.0000000001)) {

         v4 = (v14 / v20 + 1.0) * 50.0;
         if (v4 > 100.0) v4 = 100.0;
         if (v4 < 0.0) v4 = 0.0;

      } else {
         v4 = 50.0;
      }

      rsx[shift]=v4;
   }

   return(0);

}
Sample
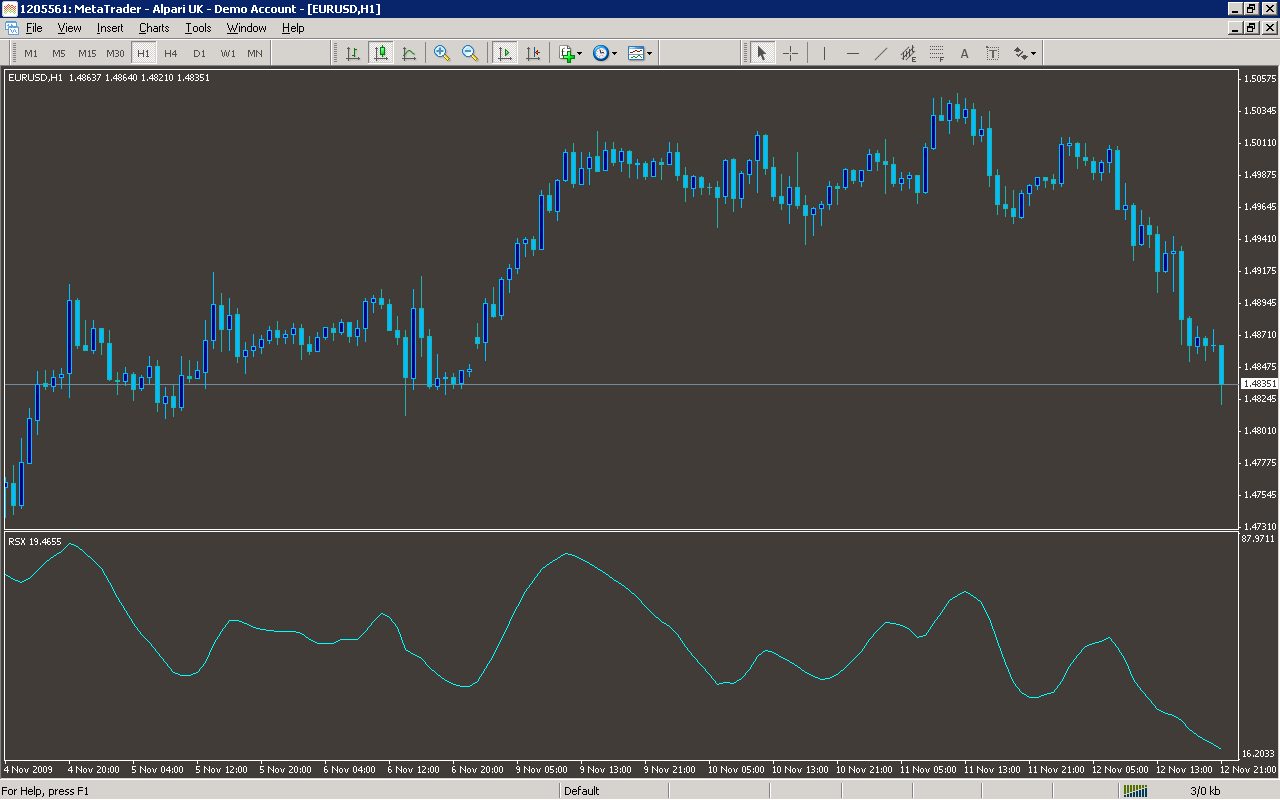
Analysis
Market Information Used:
Series array that contains close prices for each bar
Indicator Curves created:
Implements a curve of type DRAW_LINE
Indicators Used:
Custom Indicators Used:
Order Management characteristics:
Other Features: