//+------------------------------------------------------------------+
//|                                                      RuleOf9.mq4 |
//+------------------------------------------------------------------+
#property indicator_separate_window
#property indicator_buffers 4
#property indicator_color1 Yellow
#property indicator_color2 DodgerBlue
#property indicator_color3 LimeGreen
#property indicator_color4 OrangeRed
#property indicator_level1 0
#property indicator_level2 8
#property indicator_level3 -8

extern string TimeFrame_value = "TimeFrame(0,M5,M15,M30,H1,D1)";
extern string TimeFrame = "0";
extern int SumPeriod = 30;
extern string Sum_Mode = "0=Close-Open, 1=+1/-1";
extern int SumMode = 1;
extern string Day_Calculation_Type = "0=Brian,1=Logical Trader,2=Amibroker";
extern int Calculation_Type = 0;

double P, PRU, PRD, R, D;

double LastValue[];
double HSum[];
double LSum[];
double SumValue[];

int LastBar = -1;

double HCount[];
double LCount[];

double HigherTimeFrameValue[];
int timeFrame = 0;

int init() {

   IndicatorBuffers(4);

   SetIndexStyle(0,DRAW_LINE);
   SetIndexBuffer(0,LastValue);
   SetIndexLabel(0,"Price_C_O");
   SetIndexStyle(1,DRAW_HISTOGRAM);
   SetIndexBuffer(1,SumValue);
   SetIndexLabel(1,"C_O_Sum(" + SumPeriod + ")");
   SetIndexStyle(2,DRAW_LINE, STYLE_SOLID);
   SetIndexBuffer(2,HSum);
   SetIndexLabel(2,"Highest Sum");
   SetIndexStyle(3,DRAW_LINE, STYLE_SOLID);
   SetIndexBuffer(3,LSum);
   SetIndexLabel(3,"Lowest Sum");

   SetIndexStyle(4,DRAW_LINE, STYLE_SOLID);
   SetIndexBuffer(4,LSum);
   SetIndexLabel(4,"Lowest Sum");

   for(int idx=0; idx < SumPeriod; idx++) {

      SumValue[idx] = 0.0;
      HCount[idx] = 0.0;
      LCount[idx] = 0.0;
      HSum[idx] = 0.0;
      LSum[idx] = 0.0;
      LastValue[idx] = 0.0;

   }

   if (TimeFrame == "M5") {

      timeFrame = PERIOD_M5;

   } else if (TimeFrame == "M15") {

      timeFrame = PERIOD_M15;

   } else if (TimeFrame == "M30") {

      timeFrame = PERIOD_M30;

   } else if (TimeFrame == "H1") {

      timeFrame = PERIOD_H1;

   } else if (TimeFrame == "H4") {

      timeFrame = PERIOD_H4;

   } else if (TimeFrame == "D1") {

      timeFrame = PERIOD_D1;

   } else {

      timeFrame = 0;

   }

   LastBar = iTime(NULL, 0, 0);

   return(0);

}

int deinit() {

   return(0);

}

int start() {

   int i, counted_bars = IndicatorCounted();
   i = Bars - counted_bars - 1;
   double sum = 0;

   if (i < SumPeriod) {

      i = SumPeriod;

   }

   while (i >= 0) {

      if (iTime(NULL, timeFrame, i) != LastBar) {

         LastBar = iTime(NULL, timeFrame, i);
         sum = 0;

         if (Calculation_Type == 0 || (Calculation_Type != 1 && Calculation_Type != 2)) {

            D = (iOpen(NULL, timeFrame, i) - iClose(NULL, timeFrame, i+1));

         } else if (Calculation_Type == 1) {

            D = (iClose(NULL, timeFrame, i+1) - iOpen(NULL, timeFrame, i+1));

         } else if (Calculation_Type == 2) {

            D = (iClose(NULL, timeFrame, i) - iOpen(NULL, timeFrame, i+1));

         }

/*         // Experiment of the logical trader book ACD signal
         P = (iHigh(NULL, PERIOD_D1, i+1) + iLow(NULL, PERIOD_D1, i+1) + iClose(NULL, PERIOD_D1, i+1)) / 3;
         R = (iHigh(NULL, PERIOD_D1, i+1) + iLow(NULL, PERIOD_D1, i+1)) / 2;
         PRU = P+(MathAbs(P-R));
         PRD = P-(MathAbs(P-R));

         if (iOpen(NULL, PERIOD_D1, i+1) <= PRU && iClose(NULL, PERIOD_D1, i+1) > PRU) {

            LastValueUp[i] = 2;

         } else if (iOpen(NULL, PERIOD_D1, i+1) >= PRD && iClose(NULL, PERIOD_D1, i+1) < PRD) {

            LastValueUp[i] = -2;

         } else {

            LastValueUp[i] = 0;

         }
*/

         if (SumMode == 0) {

            LastValue[i] = D;

         } else {

            if (D > 0) {

               LastValue[i] = 1;

            } else {

               LastValue[i] = -1;

            }


         }

         int period = 0;

         if (SumPeriod > ArraySize(LastValue)) {

            period = ArraySize(LastValue);

         } else {

            period = SumPeriod;

         }

         for(int idx=0; idx<period; idx++) {

            sum += LastValue[i+idx];

         }

         SumValue[i] = sum;

         HSum[i] = SumValue[ArrayMaximum(SumValue, SumPeriod*8, 0)];
         LSum[i] = SumValue[ArrayMinimum(SumValue, SumPeriod*8, 0)];

         if (SumValue[i] >= 8) {

            HCount[i] = HCount[i+1] + 1;

         } else {

            HCount[i] = 0.0;

         }
         if (SumValue[i] <= -8) {

            LCount[i] = LCount[i+1] + 1;

         } else {

            LCount[i] = 0.0;

         }

         if (LCount[i] <= -9 || HCount[i] >= 9) {

            Alert("Potential trend change on ", TimeToStr(Time[i], TIME_DATE));

         }

      }

      i--;

   }

   return(0);

}
//+------------------------------------------------------------------+
Sample
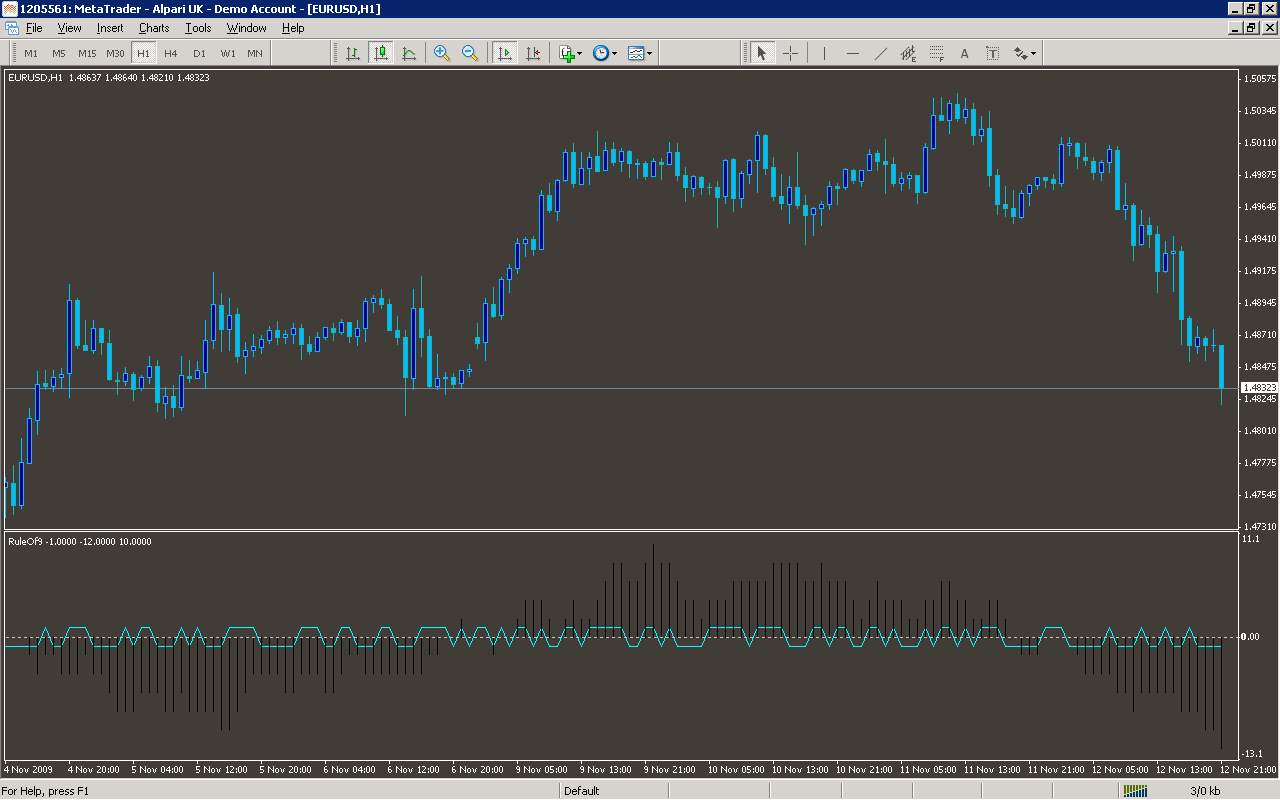
Analysis
Market Information Used:
Series array that contains open prices of each bar
Series array that contains close prices for each bar
Series array that contains the highest prices of each bar
Series array that contains the lowest prices of each bar
Series array that contains open time of each bar
Indicator Curves created:
Implements a curve of type DRAW_LINE
Implements a curve of type DRAW_HISTOGRAM
Indicators Used:
Custom Indicators Used:
Order Management characteristics:
Other Features:
It issuies visual alerts to the screen