//+------------------------------------------------------------------+
//|   SeNSetiVe.mq4                                                  |
//|   QuantifiEd                                                     |
//|   MySpons@rambler.ru                            Copyright © 2006 |
//+------------------------------------------------------------------+
#property copyright "QuantifiEd"
#property link      ""
//----
#property  indicator_separate_window
#property  indicator_buffers 1
#property indicator_color1 DarkBlue
//----
extern int SPerioD=150;
extern int SFactoR=7;
extern int ShiFt=0;
double buff[];
double Max,Min;
int init()
  {
   string SN;
//----
   SetIndexStyle(0,DRAW_LINE);
   SetIndexBuffer(0,buff);
   SN="SeNSetiVe("+SPerioD+","+SFactoR+","+ShiFt+")";
   IndicatorShortName(SN);
   SetIndexLabel(0,SN);
   SetIndexDrawBegin(0,SPerioD);
//----
  return(0);
  }
//+------------------------------------------------------------------+
//|                                                                  |
//+------------------------------------------------------------------+
int start()
  {
   int i,counted_bars=IndicatorCounted();
//----
   if(Bars<=SPerioD) return(0);
   if(counted_bars<1)
      for(i=1;i<=SPerioD;i++) buff[Bars-i]=0.0;
   i=Bars-SPerioD-1;
   if(counted_bars>=SPerioD) i=Bars-counted_bars-1;
   while(i>=0)
     {
      Max=High[Highest(Symbol(),0,MODE_HIGH,SFactoR,i)];
      Min=Low[Lowest(Symbol(),0,MODE_LOW,SFactoR,i)];
      double hi =iMA(NULL,0,SPerioD,ShiFt,MODE_SMA,PRICE_HIGH,i);
      double lo =iMA(NULL,0,SPerioD,ShiFt,MODE_SMA,PRICE_LOW,i);
      double op =iMA(NULL,0,SPerioD,ShiFt,MODE_SMA,PRICE_OPEN,i);
      double cl =iMA(NULL,0,SPerioD,ShiFt,MODE_SMA,PRICE_CLOSE,i);
      buff[i]=(5*cl-5*op+Max+Min-hi-lo)*Volume[i];
     i--; }
   return(0);
  }
//+------------------------------------------------------------------+
Sample
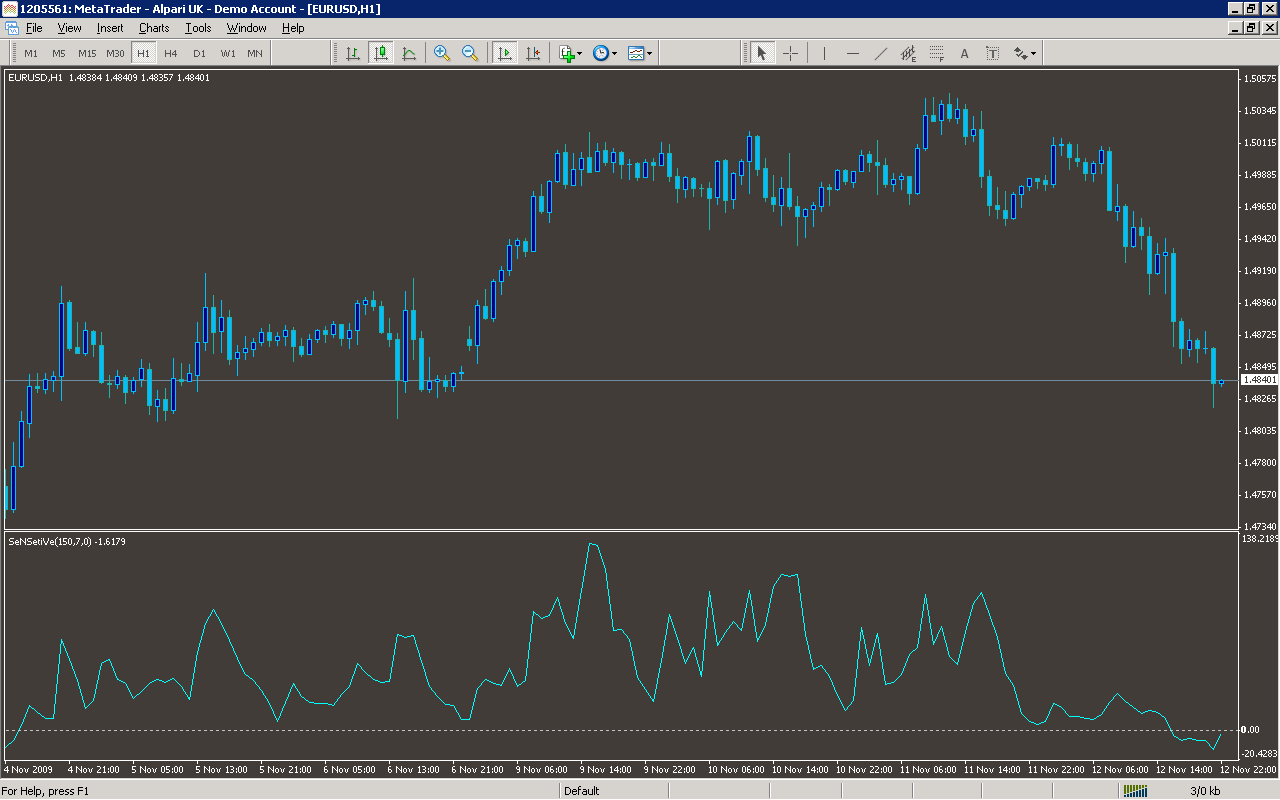
Analysis
Market Information Used:
Series array that contains the highest prices of each bar
Series array that contains the lowest prices of each bar
Series array that contains tick volumes of each bar
Indicator Curves created:
Implements a curve of type DRAW_LINE
Indicators Used:
Moving average indicator
Custom Indicators Used:
Order Management characteristics:
Other Features: