//+------------------------------------------------------------------+
//|                                             DailyPivotPoints.mq4 |
//|                      Copyright © 2005, MetaQuotes Software Corp. |
//|                                        http://www.metaquotes.net |
//+------------------------------------------------------------------+
#property copyright "Copyright © 2005, MetaQuotes Software Corp."
#property link      "http://www.metaquotes.net"

#property indicator_chart_window
#property indicator_buffers 2
#property indicator_color1 Blue
#property indicator_color2 Red
//---- input parameters
extern int       ExtFormula=0;
extern int       ExtHowManyDays=30;
extern bool      ExtDraw=true;
//---- buffers
double ExtMapBuffer1[];
double ExtMapBuffer2[];
//+------------------------------------------------------------------+
//| Custom indicator initialization function                         |
//+------------------------------------------------------------------+
int init()
  {
//---- indicators
   SetIndexStyle(0,DRAW_LINE);
   SetIndexBuffer(0,ExtMapBuffer1);
   SetIndexEmptyValue(0,0.0);
   SetIndexStyle(1,DRAW_LINE);
   SetIndexBuffer(1,ExtMapBuffer2);
   SetIndexEmptyValue(1,0.0);
//---- clear buffers when reinitializing
   if(ArraySize(ExtMapBuffer1)>0) ArrayInitialize(ExtMapBuffer1,0.0);
   if(ArraySize(ExtMapBuffer2)>0) ArrayInitialize(ExtMapBuffer2,0.0);
//---- set labels for DataWindow
   if(ExtDraw)
     {
      if(ExtFormula==0)
        {
         SetIndexLabel(0,"Pivot");
         SetIndexLabel(1,NULL);
        }
       else
        {
         SetIndexLabel(0,"Resistance");
         SetIndexLabel(1,"Support");
        }
     }
    else
     {
      SetIndexLabel(0,NULL);
      SetIndexLabel(1,NULL);
     }
//---- force daily data load
   iBars(NULL,PERIOD_D1);
//----
   return(0);
  }
//+------------------------------------------------------------------+
//| Custom indicator deinitialization function                       |
//+------------------------------------------------------------------+
int deinit()
  {
//---- deleting our lines
   ObjectDelete("Pivot_Line");
   ObjectDelete("R0.5_Line");
   ObjectDelete("R1.0_Line");
   ObjectDelete("R1.5_Line");
   ObjectDelete("R2.0_Line");
   ObjectDelete("R2.5_Line");
   ObjectDelete("R3.0_Line");
   ObjectDelete("S0.5_Line");
   ObjectDelete("S1.0_Line");
   ObjectDelete("S1.5_Line");
   ObjectDelete("S2.0_Line");
   ObjectDelete("S2.5_Line");
   ObjectDelete("S3.0_Line");
//----
   return(0);
  }
//+------------------------------------------------------------------+
//| Custom indicator iteration function                              |
//+------------------------------------------------------------------+
int start()
  {
   int    counted_bars=IndicatorCounted();
   int    begin_bar, first_bar, last_bar, cnt;
   double yesterday_high, yesterday_low, yesterday_close, today_open;
   double P, S, R, S05, R05, S10, R10, S15, R15, S20, R20, S25, R25, S30, R30;
//---- test parameters
   if(ExtFormula<0 || ExtFormula>3) return(-1);
   if(Period()>=PERIOD_D1)          return(-1);
//---- if daily data not loaded yet
   while(true)
     {
      if(iTime(NULL,PERIOD_D1,0)>=(Time[0]-PERIOD_D1*60)) break;
      Sleep(1000);
     }
//---- set check beginning
   if(ExtHowManyDays<1) begin_bar=iBars(NULL,PERIOD_D1)-2;
   else                 begin_bar=ExtHowManyDays-1;
//---- case of recounting current pivot only
   if(ExtDraw==false || counted_bars>0) begin_bar=0;
//----
   for(cnt=begin_bar; cnt>=0; cnt--)
     {
      yesterday_close=iClose(NULL,PERIOD_D1,cnt+1);
      today_open=iOpen(NULL,PERIOD_D1,cnt);
      yesterday_high=iHigh(NULL,PERIOD_D1,cnt+1);
      yesterday_low=iLow(NULL,PERIOD_D1,cnt+1);
      P = (yesterday_high + yesterday_low + yesterday_close + today_open) / 4;
      switch(ExtFormula)
        {
         case 1 :
            R = P + P - yesterday_low;
            S = P + P - yesterday_high;
            break;
         case 2 :
            R = P + yesterday_high - yesterday_low;
            S = P - yesterday_high + yesterday_low;
            break;
         case 3 :
            R = P + P - yesterday_low - yesterday_low + yesterday_high;
            S = P + P - yesterday_high - yesterday_high + yesterday_low;
        }
      if(ExtDraw==true)
        {
         first_bar=iBarShift(NULL,0,iTime(NULL,PERIOD_D1,cnt))-1;
         if(cnt>0) last_bar=iBarShift(NULL,0,iTime(NULL,PERIOD_D1,cnt-1))-1;
         else last_bar=0;
         while(first_bar>=last_bar)
           {
            if(first_bar==last_bar && last_bar>0) break;
            if(ExtFormula==0) ExtMapBuffer1[first_bar]=P;
            else
              {
               ExtMapBuffer1[first_bar]=R;
               ExtMapBuffer2[first_bar]=S;
              }
             first_bar--;
           }
        }
     }
   P = NormalizeDouble((yesterday_high + yesterday_low + yesterday_close)/3,Digits);

   R10 = NormalizeDouble((2*P)-yesterday_low,Digits);
   S10 = NormalizeDouble((2*P)-yesterday_high,Digits);

   R05 = NormalizeDouble((P+R10)/2,Digits);
   S05 = NormalizeDouble((P+S10)/2,Digits);

   R20 = NormalizeDouble(P+(yesterday_high-yesterday_low),Digits);
   S20 = NormalizeDouble(P-(yesterday_high-yesterday_low),Digits);

   R15 = NormalizeDouble((R10+R20)/2,Digits);
   S15 = NormalizeDouble((S10+S20)/2,Digits);

   R30 = NormalizeDouble(2*P+(yesterday_high-2*yesterday_low),Digits);
   S30 = NormalizeDouble(2*P-(2*yesterday_high-yesterday_low),Digits);

   R25 = NormalizeDouble((R20+R30)/2,Digits);
   S25 = NormalizeDouble((S20+S30)/2,Digits);

   ObjectCreate("Pivot_Line", OBJ_HLINE, 0, 0, P);
   ObjectSet("Pivot_Line", OBJPROP_COLOR, Yellow);
   ObjectSet("Pivot_Line", OBJPROP_STYLE, STYLE_SOLID);
   ObjectSetText("Pivot_Line","Pivot "+DoubleToStr(P,Digits));

   ObjectCreate("R0.5_Line", OBJ_HLINE, 0, 0, R05);
   ObjectSet("R0.5_Line", OBJPROP_COLOR, GreenYellow);
   ObjectSet("R0.5_Line", OBJPROP_STYLE, STYLE_DOT);
   ObjectSetText("R0.5_Line","R0.5 "+DoubleToStr(R05,Digits));

   ObjectCreate("R1.0_Line", OBJ_HLINE, 0, 0, R10);
   ObjectSet("R1.0_Line", OBJPROP_COLOR, YellowGreen);
   ObjectSet("R1.0_Line", OBJPROP_STYLE, STYLE_DOT);
   ObjectSetText("R1.0_Line","R1.0 "+DoubleToStr(R10,Digits));

   ObjectCreate("R1.5_Line", OBJ_HLINE, 0, 0, R15);
   ObjectSet("R1.5_Line", OBJPROP_COLOR, GreenYellow);
   ObjectSet("R1.5_Line", OBJPROP_STYLE, STYLE_DOT);
   ObjectSetText("R1.5_Line","R1.5 "+DoubleToStr(R15,Digits));

   ObjectCreate("R2.0_Line", OBJ_HLINE, 0, 0, R20);
   ObjectSet("R2.0_Line", OBJPROP_COLOR, YellowGreen);
   ObjectSet("R2.0_Line", OBJPROP_STYLE, STYLE_DOT);
   ObjectSetText("R2.0_Line","R2.0 "+DoubleToStr(R20,Digits));

   ObjectCreate("R2.5_Line", OBJ_HLINE, 0, 0, R25);
   ObjectSet("R2.5_Line", OBJPROP_COLOR, GreenYellow);
   ObjectSet("R2.5_Line", OBJPROP_STYLE, STYLE_DOT);
   ObjectSetText("R2.5_Line","R2.5 "+DoubleToStr(R25,Digits));

   ObjectCreate("R3.0_Line", OBJ_HLINE, 0, 0, R30);
   ObjectSet("R3.0_Line", OBJPROP_COLOR, YellowGreen);
   ObjectSet("R3.0_Line", OBJPROP_STYLE, STYLE_DOT);
   ObjectSetText("R3.0_Line","R3.0 "+DoubleToStr(R30,Digits));

   ObjectCreate("S0.5_Line", OBJ_HLINE, 0, 0, S05);
   ObjectSet("S0.5_Line", OBJPROP_COLOR, Salmon);
   ObjectSet("S0.5_Line", OBJPROP_STYLE, STYLE_DOT);
   ObjectSetText("S0.5_Line","S0.5 "+DoubleToStr(S05,Digits));

   ObjectCreate("S1.0_Line", OBJ_HLINE, 0, 0, S10);
   ObjectSet("S1.0_Line", OBJPROP_COLOR, Salmon);
   ObjectSet("S1.0_Line", OBJPROP_STYLE, STYLE_DOT);
   ObjectSetText("S1.0_Line","S1.0 "+DoubleToStr(S10,Digits));

   ObjectCreate("S1.5_Line", OBJ_HLINE, 0, 0, S15);
   ObjectSet("S1.5_Line", OBJPROP_COLOR, Salmon);
   ObjectSet("S1.5_Line", OBJPROP_STYLE, STYLE_DOT);
   ObjectSetText("S1.5_Line","S1.5 "+DoubleToStr(S15,Digits));

   ObjectCreate("S2.0_Line", OBJ_HLINE, 0, 0, S20);
   ObjectSet("S2.0_Line", OBJPROP_COLOR, Salmon);
   ObjectSet("S2.0_Line", OBJPROP_STYLE, STYLE_DOT);
   ObjectSetText("S2.0_Line","S2.0 "+DoubleToStr(S20,Digits));

   ObjectCreate("S2.5_Line", OBJ_HLINE, 0, 0, S25);
   ObjectSet("S2.5_Line", OBJPROP_COLOR, Salmon);
   ObjectSet("S2.5_Line", OBJPROP_STYLE, STYLE_DOT);
   ObjectSetText("S2.5_Line","S2.5 "+DoubleToStr(S25,Digits));

   ObjectCreate("S3.0_Line", OBJ_HLINE, 0, 0, S30);
   ObjectSet("S3.0_Line", OBJPROP_COLOR, Salmon);
   ObjectSet("S3.0_Line", OBJPROP_STYLE, STYLE_DOT);
   ObjectSetText("S3.0_Line","S3.0 "+DoubleToStr(S30,Digits));
//---- force objects drawing
   ObjectsRedraw();
//----
   return(0);
  }
//+------------------------------------------------------------------+
Sample
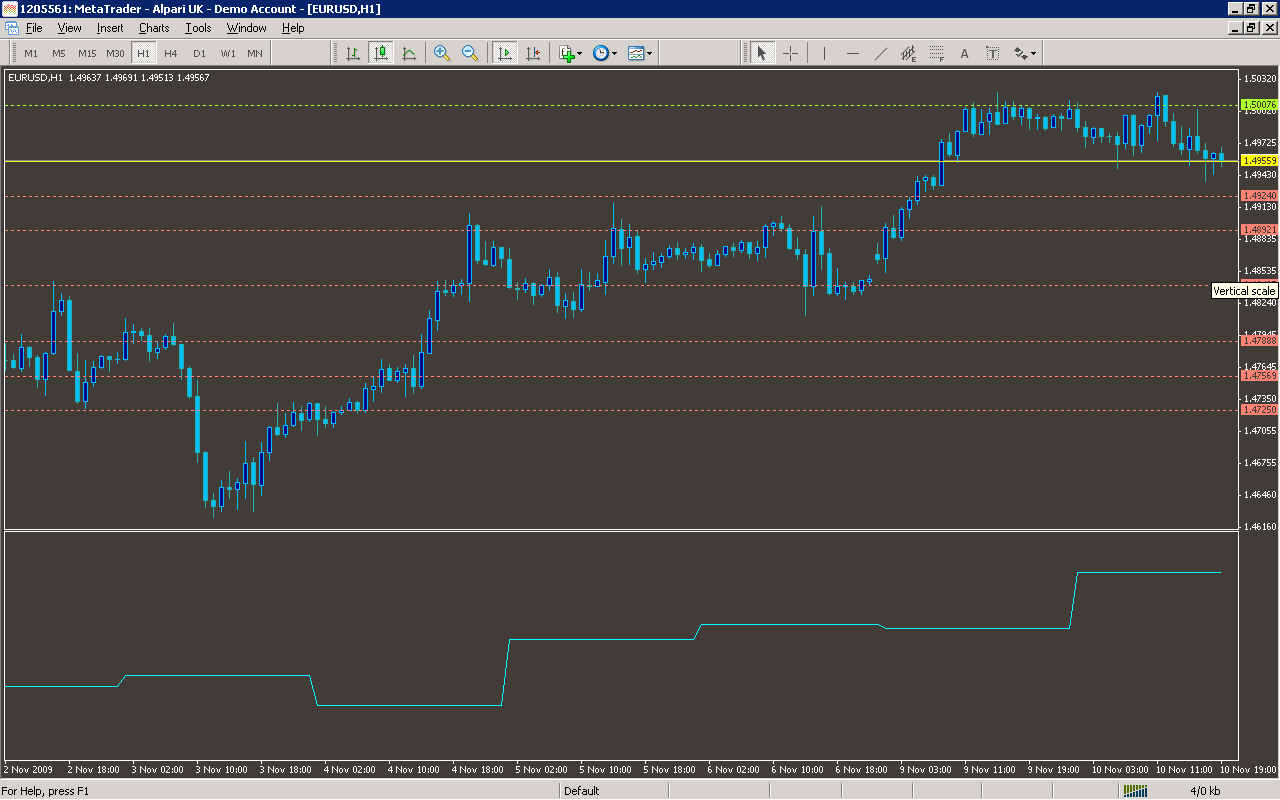
Analysis
Market Information Used:
Series array that contains open time of each bar
Series array that contains close prices for each bar
Series array that contains open prices of each bar
Series array that contains the highest prices of each bar
Series array that contains the lowest prices of each bar
Indicator Curves created:
Implements a curve of type DRAW_LINE
Indicators Used:
Custom Indicators Used:
Order Management characteristics:
Other Features: