//+------------------------------------------------------------------+
//|                                                   Day Chenel.mq4 |
//|                                               Alexandr Shvedenko |
//|                                        http://www.metaquotes.net |
//+------------------------------------------------------------------+
#property copyright "Alexandr Shvedenko"


#property indicator_chart_window
#property indicator_buffers 5
#property indicator_color1 DodgerBlue
#property indicator_color2 Red
#property indicator_color3 Yellow
#property indicator_color4 LightSkyBlue
#property indicator_color5 Coral
//---- input parameters
extern double Fibo=0.382;
//---- buffers
double DailyHigh[];
double DailyLow[];
double DailyMed[];
double DailyMedH[];
double DailyMedL[];
//+------------------------------------------------------------------+
//| Custom indicator initialization function                         |
//+------------------------------------------------------------------+
int init()
  {
   string short_name;
//---- indicator line
   SetIndexStyle(0,DRAW_LINE,STYLE_SOLID,2);
   SetIndexStyle(1,DRAW_LINE,STYLE_SOLID,2);
   SetIndexStyle(2,DRAW_LINE,STYLE_SOLID,2);
   SetIndexStyle(3,DRAW_LINE,STYLE_SOLID,1);
   SetIndexStyle(4,DRAW_LINE,STYLE_SOLID,1);
   SetIndexBuffer(0,DailyHigh);
   SetIndexBuffer(1,DailyLow);
   SetIndexBuffer(2,DailyMed);
   SetIndexBuffer(3,DailyMedH);
   SetIndexBuffer(4,DailyMedL);

   IndicatorShortName(short_name);
   SetIndexLabel(0,"Up Channel");
   SetIndexLabel(1,"Down Channel");
   SetIndexLabel(2,"Middle Channel");
   SetIndexLabel(2,"Middle High Channel");
   SetIndexLabel(2,"Middle Low Channel");

   return(0);
  }
//+------------------------------------------------------------------+
//| Price Channel                                                         |
//+------------------------------------------------------------------+
int start()
  {
  int limit,n,ho,lo;
   int counted_bars=IndicatorCounted();
   if (counted_bars<0) return (-1);
   if (counted_bars>0) counted_bars--;
   limit=Bars-counted_bars;

//---- indicator calculation

    for(int i=limit; i>=0; i--)
    {

n=MathCeil((TimeHour(Time[i])*60+TimeMinute(Time[i]))/Period());
if (n<1)
{
n=1;
} else
{
n=n;
}


ho=Highest(NULL,0,MODE_HIGH,n,i);
DailyHigh[i]=High[ho];
lo=Lowest(NULL,0,MODE_LOW,n,i);
DailyLow[i]=Low[lo];

DailyMed[i]=(DailyHigh[i]+DailyLow[i])/2;
DailyMedH[i]=(DailyHigh[i]-(DailyHigh[i]-DailyMed[i])*Fibo);
DailyMedL[i]=(DailyLow[i]+(DailyMed[i]-DailyLow[i])*Fibo);


//ObjectCreate("text_object", OBJ_HLINE , 0, Time[i], DailyMedH[i]);


Comment("DailyHigh=",DailyHigh[i]
        +"\n DailyLow=",DailyLow[i]
        +"\n DayleMed=",DailyMed[i]
        +"\n NN=",n
        +"\n  ho=",ho
        +"\n  lo=", lo);
 }
  }return(0);
//+------------------------------------------------------------------+
Sample
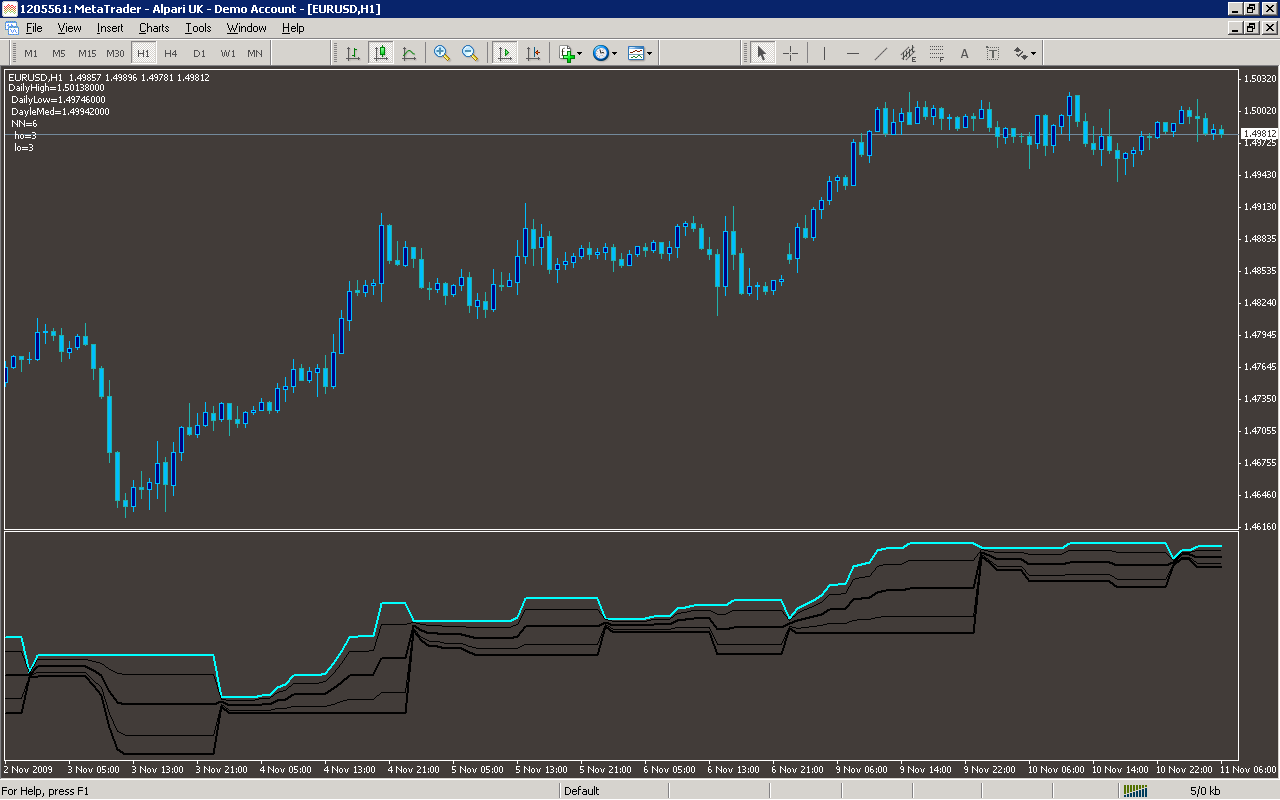
Analysis
Market Information Used:
Series array that contains the highest prices of each bar
Series array that contains the lowest prices of each bar
Series array that contains open time of each bar
Indicator Curves created:
Implements a curve of type DRAW_LINE
Indicators Used:
Custom Indicators Used:
Order Management characteristics:
Other Features: