/*-----------------------------+
|			       |
| Shared by www.Aptrafx.com    |
|			       |
+------------------------------*/

/*
original formula)
WH:=HHV(HIGH,5);
WL:=LLV(LOW,5);

//WRD:=(( HHV( WH,36 )-c ) /( HHV(WH,36 ) - LLV( WL,36) ) ) *- 100,

//WDo:=WRD+50;

//WU:=IF(WDo>0,WDo,0);
//WD:=IF(WDo<0,WDo,0);
//{- this will give you the william's when it is below zero and it is plotted red}
//LN:=0;

*/

#property indicator_separate_window
#property indicator_buffers 3
#property indicator_color1 LimeGreen
#property indicator_color2 Red
#property indicator_color3 Gray
#property indicator_maximum 50
#property indicator_minimum -50

//---- input parameters


//---- buffers

double WU[],WD[],W[],Zero[];
int ssw=0,bsw=0;
//+------------------------------------------------------------------+
//| Custom indicator initialization function                         |
//+------------------------------------------------------------------+
int init()
  {
   string short_name;
//---- 3 additional buffers are used for counting.
   IndicatorBuffers(4);
   SetIndexBuffer(3,W);
//---- indicator lines
   SetIndexStyle(0,DRAW_HISTOGRAM,0,3);
   SetIndexBuffer(0,WU);
   SetIndexStyle(1,DRAW_HISTOGRAM,0,3);
   SetIndexBuffer(1,WD);
      SetIndexStyle(2,DRAW_LINE,0,2);
   SetIndexBuffer(2,Zero);
//---- name for DataWindow and indicator subwindow label
   short_name="William%R36 With Alert";
   IndicatorShortName(short_name);


//---- indicator lines


//----
   SetIndexDrawBegin(0,40);
//----
   return(0);
  }
//+------------------------------------------------------------------+
//| BSPVolume
//+------------------------------------------------------------------+
int start()
 {
   int    i,k,counted_bars=IndicatorCounted();

   if(Bars<=40) return(0);
//---- initial zero
/*
  if(counted_bars<1)
     {
      for(i=1;i<=CCIPeriod;i++) CCIBuffer[Bars-i]=0.0;
      for(i=1;i<=CCIPeriod;i++) DevBuffer[Bars-i]=0.0;
      for(i=1;i<=CCIPeriod;i++) MovBuffer[Bars-i]=0.0;
     }
*/
//---- last counted bar will be recounted
   int limit=Bars-counted_bars;
   if (counted_bars>0) limit++; else if (limit>300) limit=300;


   for(i=0; i<limit; i++)
      W[i]=50+(-100)*(High[Highest(NULL,0,MODE_HIGH,40,i)]-Close[i])/(High[Highest(NULL,0,MODE_HIGH,40,i)]-Low[Lowest(NULL,0,MODE_LOW,40,i)]);

for(i=0; i<limit; i++) Zero[i]=0;

   for(i=0; i<limit; i++)
  {

   Comment ("i ",i,"W[i] ",W[i],"W[i+1] ",W[i+1]);
            if (W[i]<0 && W[i+1]>0 && i<2 )Alert (Symbol()," ",Period()," Willy Says S E L L");
            if (W[i]>0 && W[i+1]<0 && i<2 )Alert (Symbol()," ",Period()," Willy Says B U Y");
   if (W[i]>0)
      {WU[i]=W[i];WD[i]=0;}

      else if (W[i]<0)
          {WU[i]=0;WD[i]=W[i];}

            else {WU[i]=0;WD[i]=0;}
        }
            return(0);

}
Sample
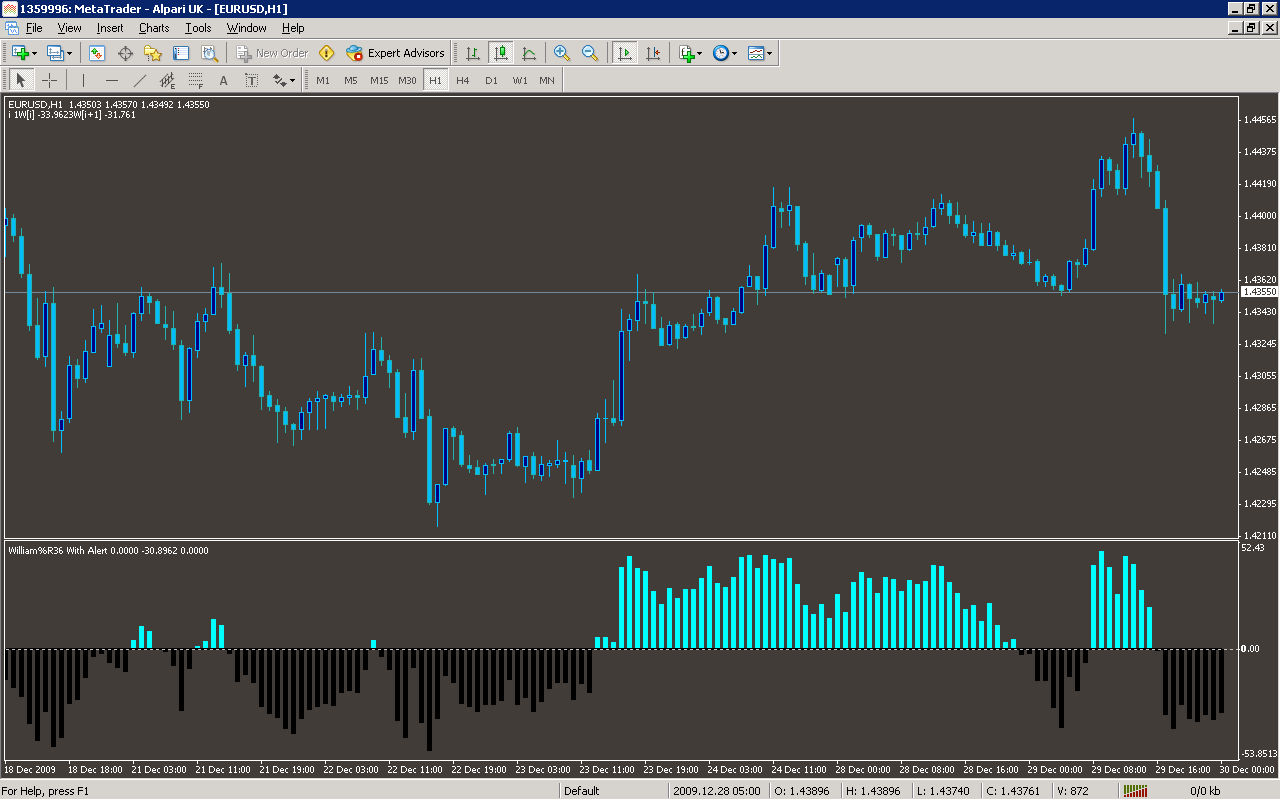
Analysis
Market Information Used:
Series array that contains close prices for each bar
Series array that contains the highest prices of each bar
Series array that contains the lowest prices of each bar
Indicator Curves created:
Implements a curve of type DRAW_HISTOGRAM
Implements a curve of type DRAW_LINE
Indicators Used:
Custom Indicators Used:
Order Management characteristics:
Other Features: